


TL;DR - Key Takeaways
A quick overview for busy decision-makers.
Your purchasing team reviews replenishment requests all week, yet the materials tying up the most money still get lost among routine orders. Meanwhile, a cheap fitting goes missing and production can’t finish a customer order. ABCABC Inventory Analysis is a method of classifying inventory into A, B, and C categories based on consumption value. It helps businesses prioritize stock control, optimize purchasing, reduce inventory costs, and improve warehouse efficiency. inventory analysis helps managers focus their attention, but only when financial ranking and production risk remain separate decisions.
The practical approach is to classify items by annual consumption value, check the exceptions, and assign buying and counting rules that people can follow. A spreadsheet can establish the ranking. Connected operational records make that ranking useful when demand, deliveries, and production plans change.
Starting Thresholds for ABC Inventory Analysis
ABC inventory analysis groups stock-keeping units, or SKUs, according to their contribution to annual consumption value. It doesn’t rank items by unit price, the number of pieces on hand, or how full a warehouse bin looks.
The starting calculation is straightforward:
Annual consumption value = Annual quantity used × Unit cost
For a hypothetical manufacturer consuming 10,000 units at €25 each, annual consumption value is €250,000. That tells the planner how much financial activity the material represents over the year, not how much stock should sit in the warehouse today.
Rank value before assigning letters
Sort every item from highest to lowest annual consumption value. Then calculate each item’s share of the total and add those shares progressively down the list. This running total determines where the categories begin and end.
SIX recommends starting with the familiar value bands below. A published SITEKIN implementation also used cumulative cutoffs through 80% for A, through 95% for B, and the remainder for C; its item distribution was approximately 20% A, 30% B, and 50% C. In that implementation, B items absorbed about 15% of funds, while C items absorbed about 5%.
Starting ABC bands by annual consumption value
| Category | Share of annual consumption value | Typical share of SKUs | Starting control |
|---|---|---|---|
| A | First 80 percent | About 10 to 20 percent | Close monitoring, accurate forecasts, frequent stock checks |
| B | Next 15 percent, cumulative 80 to 95 percent | About 20 to 30 percent | Regular reviews and structured replenishment |
| C | Remaining 5 percent | About 50 to 70 percent | Simpler purchasing and less frequent reviews |
The typical SKU ranges reflect the operating patterns described in IBM’s MRO supply-chain guide, not targets that every inventory must meet. Don’t change item classifications merely to make the SKU counts resemble the table.
Use the bands as a first pass
A furniture manufacturer, an automotive spare-parts distributor, and a food producer shouldn’t be forced into the same item mix. Their purchasing cycles, expiry risks, supplier options, and production dependencies differ.
MA Hydraulics Ltd.’s material on inventory prioritisation for hydraulic maintenance teams provides a useful maintenance-specific companion to this financial approach. When reviewing maintenance stock, ask which items account for spending and which protect equipment availability.
Practical rule: Approve the financial ranking before changing replenishment policies. An A, B, or C label isn’t permission to reduce stock.
Document the thresholds, the business scope, and the treatment of an item that crosses a boundary. I would keep that crossing item in the higher-control class for the first review, then apply the same rule consistently. A transparent convention is more useful than a mathematically neat split that buyers interpret differently.
How to Calculate Annual Consumption Value
A planner needs a repeatable calculation, not a workbook that only its creator understands. Use the latest complete annual transaction window as the baseline, then keep forward-looking demand visible alongside it.
The pharmaceutical inventory study published through PubMed Central calculates annual consumption value by multiplying quantity used or procured by unit cost. It describes an alternative expenditure split of approximately 70% for A, 20% for B, and 10% for C, which reinforces that the calculation method stays consistent even when category boundaries differ.
Build a reproducible item list
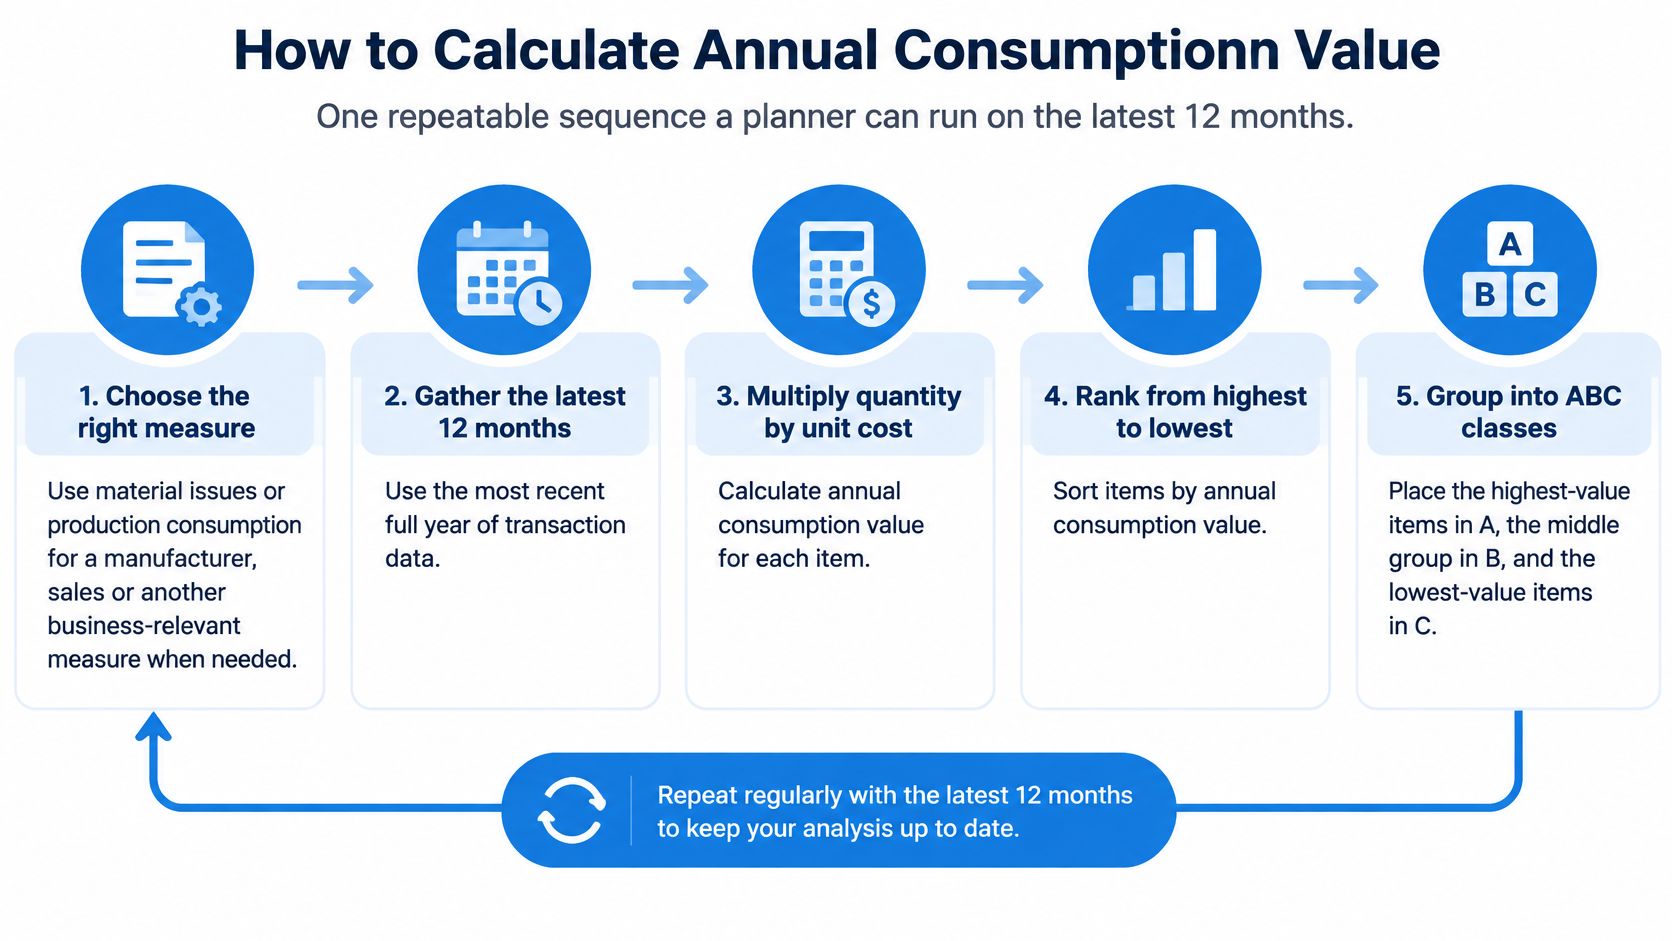
Choose the measure. For manufacturing, use material issues or recorded production consumption. For distribution, use shipped quantities valued at cost. Use purchases as a fallback when usage history is missing, and flag that limitation because buying can exceed consumption.
Extract quantities and costs. Pull the latest 12 months as a recommended review window. Include item code, description, unit of measure, warehouse, quantity consumed, and unit cost in euros. Finance should approve whether the analysis uses standard, weighted-average, or another consistent cost basis.
Multiply quantity by cost. Calculate each item’s annual consumption value. Convert purchasing packs into the stock unit before multiplying. Otherwise, a box-versus-piece mismatch can overwhelm every other refinement.
Separate exceptional transactions. Remove one-off write-offs and samples from the normal-demand ranking when they don’t represent recurring use. Preserve them in an exception report rather than deleting the underlying records.
Sort descending. Rank the complete item population by calculated value. Keep inactive stock in a separate aging review so dormant inventory doesn’t disappear from management attention.
Calculate shares. Divide each item’s value by the total value of the selected population. Add those shares down the sorted list to produce the cumulative percentage.
Apply the approved bands. Assign categories using the documented cutoffs and boundary rule. Don’t create a different convention for each buyer.
Review borderline items. Flag items close to a cutoff for human review. A small cost correction shouldn’t change an approvalAn approval is a formal decision that allows a request or action to proceed. An ERP system can route approvals and record who made each decision. route or count schedule.
Check the arithmetic against real buying behavior
The following rows are hypothetical examples within a larger inventory, not a complete classification dataset.
| Hypothetical item | Annual quantity used | Unit cost | Annual consumption value | Possible financial class |
|---|---|---|---|---|
| Main production material | 10,000 | €25 | €250,000 | A |
| High-volume component | 500,000 | €0.50 | €250,000 | A |
| Rarely used spare | 1 | €2,000 | €2,000 | C |
The low-price component can rank alongside the main material because its volume offsets its price. The expensive spare can remain C on value alone, provided its position in the full cumulative ranking supports that result.
On-hand inventory value is different. A nearly empty bin can contain an A item because annual consumption is high. For the separate decision about when to buy again, Packaging Panda’s guide to setting stock triggers for dispatch teams is a useful companion.
Save the calculation date, transaction window, cost basis, exclusions, and approving owner with the final list. That record lets finance reconcile the figures and lets the next planner reproduce them.
When a Low-Value Item Still Stops Production
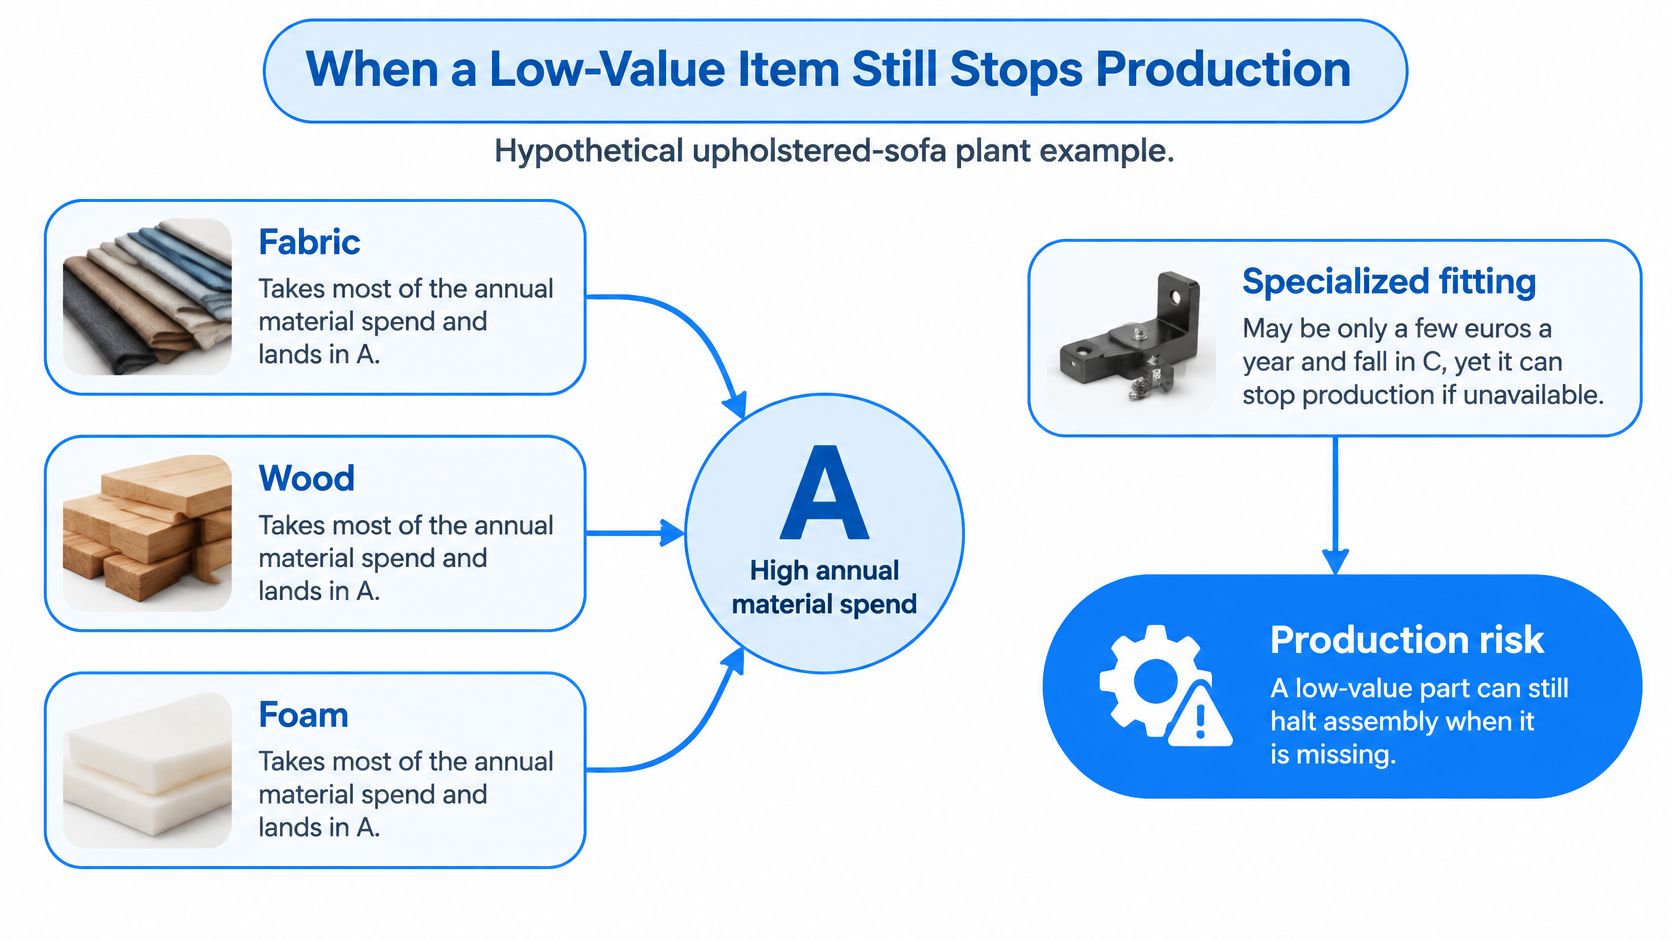
Consider a hypothetical upholstered-sofa plant. Fabric, wood, and foam account for substantial material spending and rank as A items. A specialized fitting has little annual consumption value and falls into C, yet assembly can’t complete the sofa without it.
Moving every operationally important item into A isn’t the answer. That would mix financial exposure with shortage consequences and make the ranking harder to interpret. Keep the financial class and add a separate criticality flag.
Check what makes a shortage dangerous
Production planning should identify whether the bill of materials, the approved component list for a product, permits a substitute. Purchasing should then confirm how reliably the original part or substitute can be obtained.
- Supplier lead time: Record the actual wait from ordering to usable receipt, including inspection.
- Delivery variability: Check whether promised dates are dependable, not merely short.
- Approved sources: Distinguish a genuine alternative supplier from one that hasn’t passed qualification.
- Minimum order quantity: Identify whether the supplier forces purchases well beyond likely use.
- Shelf life: Avoid solving availability with a buffer that expires before consumption.
- Substitution restrictions: Flag parts that require engineering or quality approval before replacement.
These checks can justify closer control of a C item without changing its financial classification. They can also prevent an expensive A item from receiving a large buffer when a reliable supplier can replenish it quickly.
Add demand stability with ABC-XYZ
ABC measures financial importance. XYZ describes demand predictability. X items have stable use, Y items have variable use, and Z items have irregular or intermittent use.
An expensive material with stable consumption can support a relatively tight forecast-based plan. An equally expensive material used only for occasional orders needs a different coverage decision, potentially tied to confirmed work rather than a smooth average forecast.
A 2025 supply-chain analysis from Leibniz University Hannover describes a medical-supplies study in which 30% of products had highly variable demand, and an automotive dealership case linking fluctuating demand, long backorders, and inconsistent categorization with 37% overstock and 24% dead stock. These findings support adding variability and movement checks rather than treating financial rank as a complete replenishment model.
A fast-, slow-, and non-moving classification can add another useful view. However, a non-moving emergency spare isn’t automatically obsolete. Maintenance must decide whether it still protects installed equipment.
The letter follows money. The replenishment rule must also reflect the cost of a shortage.
Decide whether classifications apply company-wide or by warehouse. Finance may need a consolidated view, while a plant planner needs local consumption and criticality. Keep those views explicitly named so a part that’s nearly idle at one site doesn’t receive the same policy everywhere.
Control Rules for A, B, and C Items
A letter on the item master changes nothing until purchasing, warehouse, and production teams change their work. Assign a review method, replenishment approach, and approval owner to each class.
Different control for each ABC class
| Class | Review and counting | Replenishment | Who approves changes |
|---|---|---|---|
| A | Frequent cycle counts and forecasts checks | Tighter cover based on lead time and confirmed demand | Purchasing lead with finance on large buys |
| B | Regular scheduled review | Standard reorder or min-max with planned orders | Buyer within agreed limits |
| C | Less frequent review | Simpler min-max or bulk buys from reliable sources | Warehouse or buyer at a lower approval level |
These are starting policies, with criticality exceptions applied separately. The government inventory-management reference recommends the highest control for A items, middle-level control for B items, and delegation of C-item control to lower decision-making levels.
Make control effort proportionate
Cycle counting means checking selected stock regularly rather than waiting for a full inventory count. For A items, investigate discrepancies promptly because an incorrect balance can trigger an expensive purchase or conceal a shortage.
For C items, simpler min-max replenishment can reduce buyer effort. The minimum triggers action, and the maximum limits the intended stock position. Bulk buying still needs a check against storage space, expiry, and future demand.
ABC doesn’t calculate a protective buffer. Use the safety stock formula guide when setting that separate control, and account for demand and lead-time uncertainty rather than assigning the same buffer to every item in a class.
Connect the records behind the policy
SIX StockFlow connects purchasing, warehousing, inventory, and fulfillment from goods receipt through delivery. Its availability and traceability records support the operational review, but the analysis shouldn’t be presented as a dedicated default ABC dashboardA dashboard brings key figures and status information together on one screen. An ERP dashboard helps teams monitor performance and identify issues that need attention..
Use connected reports to answer distinct questions:
- Inventory valuation: Where is working capital invested now?
- Movement and consumption: Which items account for recurring annual usage?
- Purchasing history: What prices, open orders, receipt dates, and supplier lead times affect the next decision?
- Availability: Which quantities are physically present, reserved, quarantined, in transit, or free for new requirements?
In a hypothetical warehouse, 500 units on hand with 450 reserved leaves 50 for new work, assuming no other restrictions. Quarantined material isn’t usable stock, and an incoming order isn’t available merely because the supplier has acknowledged it.
For manufacturing, connect the item to its bill of materials and open production requirements. The planner should see a projected shortage before releasing work, while the buyer should see incoming supply before placing another order.
Purchasing owns supplier terms and ordering parameters. Warehouse management owns count execution and location accuracy. Production approves criticality and substitution decisions, while finance reviews cash exposure and cost treatment.
Record who approves the revised policy and when it takes effect. The same financial class shouldn’t produce the same order quantity in every warehouse.
When to Recategorize and What to Measure
Set a quarterly review using the latest 12 months of consumption, with earlier checks when value, supply conditions, or production criticality changes. Daily category shifts can disrupt buying routines, especially for items near an A/B boundary. Set a minimum change threshold and require approval before the related replenishment policy changes.
Review when business conditions change
Bring forward the review when a material’s operating conditions shift:
- New customer demand: A contract lifts expected consumption above its historical pattern.
- Higher purchase prices: Annual consumption value rises even if quantity stays flat.
- A new product family: New components gain importance while demand for older materials falls.
- Unreliable supply: Less predictable lead times require an operational exception.
- Unexpected accumulation: Stock exceeds production needs and needs a disposition decision.
Use the same review sequence each time: recalculate annual value, rank items, propose classes, compare with the last review, and investigate significant movements. Then assess upcoming demand and supplier conditions, approve policy changes, and record the effective date, owner, and reason.
SIX PurchaseFlow connects purchase requests, supplier offers, approvals, purchase orders, and incoming deliveries. These linked records give purchasing, warehouse, production, and finance teams a shared basis for applying approved changes.
Prove the result separately from the classification
Consider a hypothetical company holding €500,000 of A-category inventory. A 10% reduction in average inventory investment releases approximately €50,000 of working capital. The €50,000 is working capital released, and profit depends on the financing and storage costs it avoids.
Shortages can add emergency freight or interrupt production, reducing the financial benefit. Compare the same item group before and after the policy change so shifts in product mix do not distort the result.
Measurement discipline: Track average inventory value alongside stockout frequency, fill rate, forecast error, and emergency purchasing cost. Use the inventory turnover ratio formula and calculation guide consistently with the valuation basis used for the comparison.
A 2025 high-value-products case study in Logistics found improved results for 9 of 13 materials after differentiated inventory models were applied, with a potential 33% cost reduction. Treat those findings as case-specific evidence when assessing results for another business.
Keep C items in the performance review. Aging, expiry, write-offs, and occupied space can justify liquidation, substitution, supplier returns, or make-to-order supply. To assess ABC’s contribution, document the rules changed, items measured, and whether availability held up.
Apply the Classes to Live Stock and Production
Use the consumption ranking to decide where financial review effort goes. Then assign an owner to each exception, such as a shortage, an overdue purchase, or a reservation that could delay a production order. This turns the ranking into decisions about count schedules, buying limits, and release checks.
Replace parallel lists with connected handoffs
After managers approve the ranking and exceptions, warehouse staff need current figures for available stock, reserved quantities, incoming material, and goods ready to ship. Batch and serial details should stay connected to the items that require traceability.
SIX ManufacturingFlow checks material availability before production, supports component reservations, and identifies shortages early. It updates raw-material and component stock from actual consumption and creates replenishment or purchasing requirements when inventory reaches defined levels.
When actual usage differs from the plan, production records the consumption and purchasing sees the resulting requirement. Finance can then follow the inventory and cost consequences without rebuilding the event in separate files.
Use a controlled purchase management process to carry an approved requirement through ordering and receipt. The record should show what is needed, what is already ordered, and who authorized a change.
Test alternatives without weakening control
For difficult-to-source components, engineering may investigate another production route. American Additive Manufacturing’s discussion of 3D printing for industrial supply chains offers context for that review. Any proposed substitution still needs checks for material suitability, dimensions, quality, and approval.
SIX ERPAn ERP system connects a company’s core processes—such as sales, finance, inventory, manufacturing, and service—in one place so teams can work with shared information. connects inventory, purchasing, manufacturing, and finance, so approved ABC policies can guide daily work rather than remain in a spreadsheet. The company sets its own thresholds, service targets, and applicable legal and quality controls.
Schedule a review of one product family with purchasing, warehouse management, production planning, and finance. Bring the consumption ranking, open demand, incoming orders, and assigned exception owners. Agree on policy changes and the measures that will show whether they work before extending the method across the business.
Book an appointment with a SIX Specialist to discuss one product family’s classification, shortage risks, and approval handoffs.