


The inventory turnover ratio formula divides Cost of Goods Sold by Average Inventory. Average inventory is usually Beginning Inventory plus Ending Inventory divided by two, and that gives you the cleanest first-pass view of how often stock moved in the period.
That number matters because most teams are trying to answer the same question from different angles right now. Finance wants to know how much capital is tied up, while operations wants to know whether purchasing, replenishment, and production kept pace without creating waste or shortages.
What the Inventory Turnover Ratio Formula Measures
A warehouse can look busy while cash stays tied up in stock. The inventory turnover ratio formula shows how many times inventory cycled through a period, using Cost of Goods Sold, or COGSCOGS is the direct cost of the products a business sells, used to calculate gross profit and track product costs., against Average Inventory, the stock investment that supported that activity. OpenStax describes the ratio as COGS divided by average inventory and uses the two-point average of beginning and ending inventory for that denominator OpenStax financial accounting.
A higher turn usually means stock moved faster, but the ratio is not a profit measure. The ratio counts turns per period rather than expressing a percentage, because it measures how many times the inventory base was sold and replaced. That makes it useful for finance teams watching working capital and for warehouse or production teams trying to keep stock aligned with demand.
Practical rule: if your numerator and denominator do not cover the same period and use the same accounting basis, the result can look precise and still be wrong.
The measure becomes far more useful when purchasing, warehouse, manufacturing, and finance all pull from the same record instead of manual spreadsheets. In ERPAn ERP system connects a company’s core processes—such as sales, finance, inventory, manufacturing, and service—in one place so teams can work with shared information. reporting, that means the turnover number should connect back to stock movements, receipts, issues, and production activity, so the KPI reflects what happened in the business. For teams that also track sell-through, how to calculate sell thru is a useful companion, because the two metrics answer related but different questions.
SIX FinanceFlow keeps invoicing, expenses, payments, budgets, accounting, and financial reporting in one controlled process, so finance teams can work from a current view of cash flow, costs, revenue, and profitability across the business.
How to Calculate the Ratio Step by Step
A warehouse manager can have clean stock counts and still get a misleading turnover figure if the inputs are wrong. Start with COGS from the income statement, because inventory is carried at cost and the ratio should compare cost with cost, not cost with sales markup. Then pull beginning and ending inventory from the balance sheet or stock valuation reports and average them.
Pull the right inputs
- Get COGS for the full period. Use the same accounting period you want to analyze, whether that is a month, quarter, or year.
- Calculate average inventory. Add beginning inventory and ending inventory, then divide by two.
- Divide COGS by average inventory. The result is the number of turns in that period.
Quarterly reporting needs extra care. Quarterly COGS should be annualized before you compare it with an annual inventory average ABI Journal. That detail is easy to miss in monthly dashboards, and it is one reason turnover reports get misread.
Finance check: do not pair a quarter of COGS with a full-year inventory average unless you have deliberately annualized the numerator.
A plain example makes the mechanics clearer. If COGS is $200,000 and average inventory is $50,000, the inventory turnover ratio is 4 turns. The business cycled through stock four times during the period.
If you want a quick sanity check while building your own report, use ELECTE’s turnover calculator as a back-of-envelope tool, then compare it with your ERP numbers. When the ratio is built into SIX FinanceFlow, finance can tie the calculation back to accounting records instead of relying on a separate spreadsheet.
Why the Average Inventory Choice Changes the Result
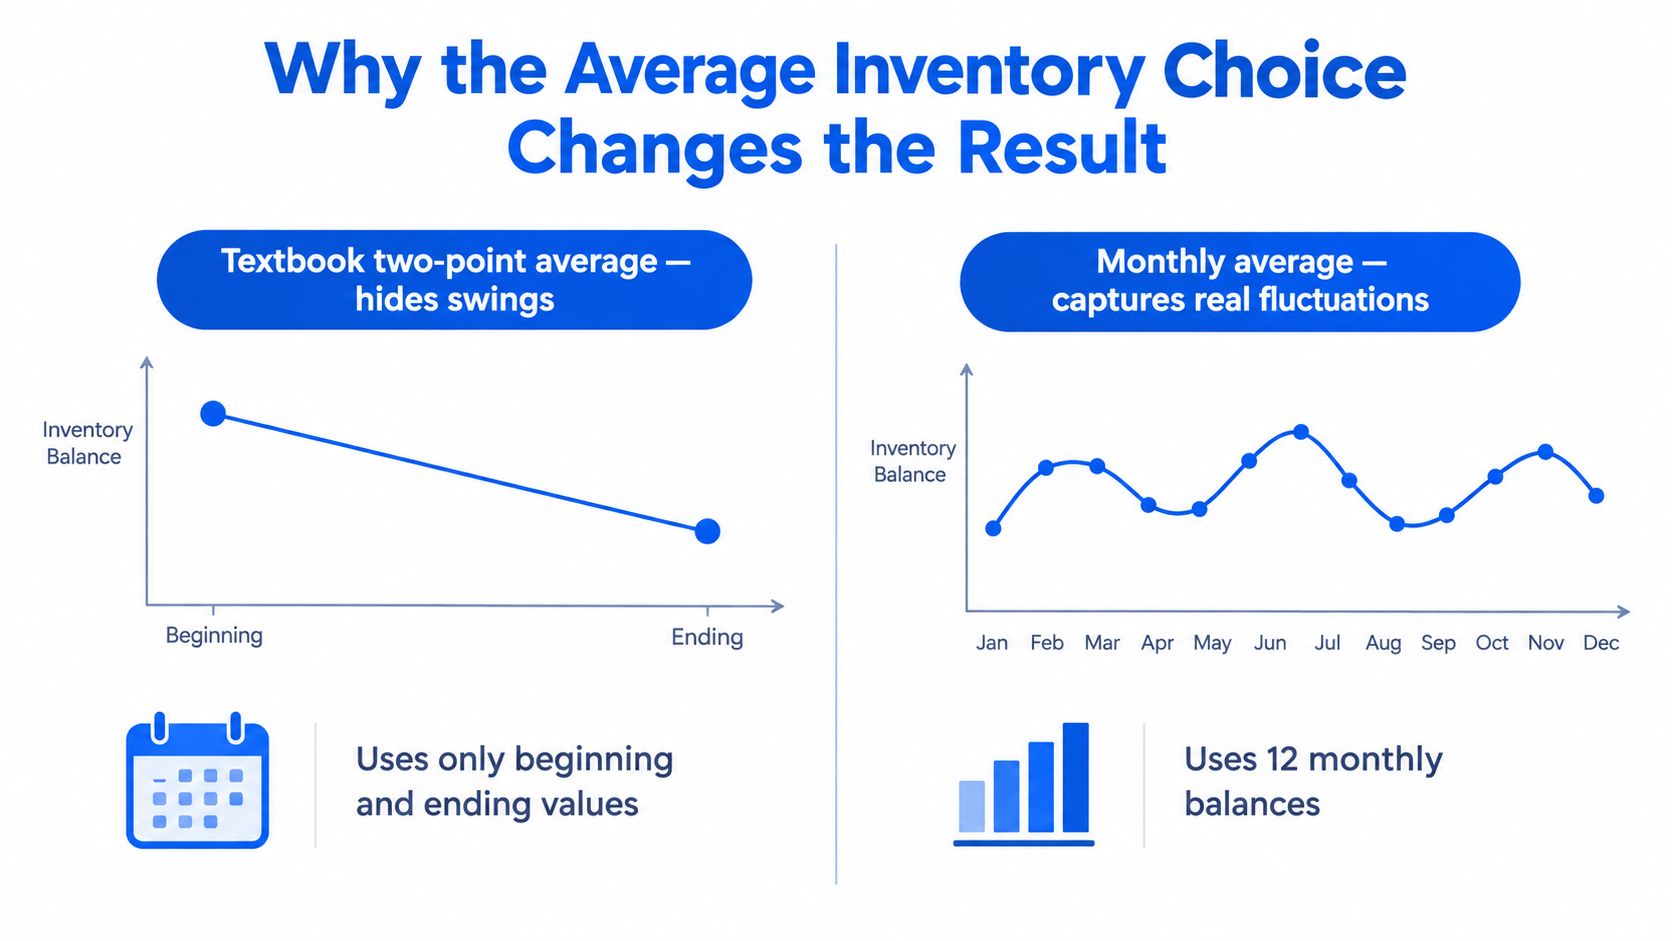
The denominator can make the ratio look better than the business really performed. A simple beginning-and-ending average works for stable stock patterns, but it can hide big swings inside the period, especially when a team cuts inventory right before month-end or year-end Investopedia.
When the simple average is enough
If stock levels stay fairly steady, the two-point average gives a usable snapshot. That often fits low-volatility businesses where replenishment follows a predictable rhythm and the inventory profile doesn’t change much from one week to the next.
When it starts to mislead
Seasonal retailers, batch-driven manufacturers, and volatile distributors need a richer denominator. A monthly or weighted average reports more accurately what was on hand across the period, instead of rewarding a late clean-up that happened just before the books closed. A business can look efficient on paper after a year-end inventory pull-down even if it carried excess stock for most of the year.
A useful test is simple:
- Seasonality rising: more pronounced peaks and troughs make the two-point average less reliable.
- Lead times stretching: longer replenishment cycles increase the cost of a bad denominator choice.
- Write-offs increasing: aging stock is a sign that the period average may be hiding too much.
- Stockouts late in the period: a flattering turn can still coexist with service failures.
SIX StockFlow connects purchasing, warehousing, inventory, and fulfilment in one controlled process, from receiving and putaway to reservations, picking, packing, and delivery, so live balances and stock movements are visible across locations.
For purchasing and replenishment logic, the operational details matter more than the headline ratio, and purchase management done right becomes part of the conversation. The goal isn’t a prettier number, it’s a denominator that reflects reality.
Converting the Ratio into Days Inventory Outstanding
Days Inventory Outstanding, or DIO, turns turnover into a number operations teams can use. The formula is 365 divided by inventory turnover, so a 5.0x turn is about 73 days and a 10.0x turn is about 36.5 days Saylor. That makes the KPI easier to compare with supplier lead times, production cycles, and service commitments.
A turn rate can feel abstract. Days in inventory shows how long cash sits in stock before it moves. Buyers, planners, and warehouse managers can tie that directly to reorder points, safety stock, and replenishment buffers.
DIO is only useful if service stays intact.
A lower DIO can come from cutting safety stock too far. Finance sees a better ratio, but the warehouse may see more stockouts, more expedites, or unstable production. Fill rate, backorders, and schedule adherence still need a check before anyone calls the result an improvement.
The same issue shows up in field service. If parts are missing when a technician arrives, the inventory ratio does not protect the customer experience. SIX ServiceFlow connects appointments, parts visibility, work completed on site, and billing, so field teams can confirm the right stock is available before a job starts.
For operations teams, DIO works best when it sits inside ERP reporting with stock movements, purchases, and production orders behind it. That keeps the number tied to real movement through receiving, putaway, reservations, picking, and consumption, instead of leaving it as a one-line finance ratio.
Worked Example for a Small Wholesale Business
A small parts distributor closes the year with annual COGS of $1.2 million, beginning inventory of $200,000, and ending inventory of $240,000. The average inventory is $220,000, because $200,000 plus $240,000 divided by 2 equals $220,000. Divide $1.2 million by $220,000, and the turnover ratio comes out to about 5.5 turns.
What that means in days
Use the DIO formula, 365 divided by 5.5, and the result is about 66 days. In plain terms, the business is holding roughly two months of stock before it moves through the system.
The same company can look better on paper with a different closing balance. If year-end clearance pulls ending inventory down to $150,000, average inventory drops to $175,000. Turnover rises to about 6.9 turns, but that improvement is partly a period-end effect, not proof that purchasing, production, or replenishment ran better all year.
That is the limitation of a simple annual formula. It gives extra weight to the closing snapshot, so a distributor can appear stronger after a heavy sell-down and still have spent most of the year carrying excess stock.
OpenStax shows the same mechanics at a smaller scale, with beginning inventory of $35,000, ending inventory of $40,000, and annual COGS of $60,000, which produces 1.6 turns OpenStax finance. The numbers are different, but the lesson is the same. The math is straightforward, and the interpretation depends on what happened to stock during the period.
For teams setting up warehouse controls, implementing a warehouse management solution helps connect the stock record to actual movement instead of end-of-period cleanup. In an ERP, that is the difference between a ratio that sits in finance and a KPI that reflects receiving, putaway, reservations, picking, and consumption.
Benchmark Ranges to Put Your Ratio in Context
There’s no single good inventory turnover ratio. Benchmarks vary by industry, shelf life, lead time, customization, and service commitments, and comparisons only make sense when the basis is the same, COGS divided by inventory, not sales divided by inventory Onramp Funds.
Illustrative inventory turnover and DIO ranges by industry
| Industry | Typical turnover range | Implied DIO range |
|---|---|---|
| Grocery | Higher, fast-moving | Lower, shorter holding period |
| Automotive retail | Moderate | Moderate holding period |
| Wholesale distribution | Moderate, varies by line | Moderate holding period |
| Apparel | Often higher than industrial categories | Shorter holding period |
| Specialty retail | Wide range, depends on assortment | Wide range, depends on assortment |
| Discrete manufacturing | Moderate, tied to production flow | Moderate holding period |
These are reference points, not targets. The right number depends on whether the business needs speed, depth of stock, or both. A grocery business has different stock dynamics than a custom manufacturer, and a specialty distributor can be healthy at a very different turn rate than a fast-fashion store.
How to read the benchmark properly
If your ratio is below a peer range, the first question is not “How do we force it up?” It’s “Are we overbuying, missing demand, or carrying the wrong mix?” If it’s above the peer range, the first question is not “How do we celebrate?” It’s “Are we close to stockout territory?”
A useful internal benchmark is the one that matches your own operating model, same period, same accounting basis, same product class. Public peer ranges help with orientation, but they don’t replace a clean internal trend line.
When a Higher Turnover Ratio Is Not a Good Sign
A higher turnover ratio can point to tighter control, or it can mean the warehouse is too thin. When stock is cut back so far that orders start missing, the ratio improves while service gets worse. Very high turnover can also signal insufficient stock and demand that is not being met.
What usually sits behind an unusually high turn
Sometimes the cause is healthy. Buyers have tightened replenishment, production is flowing more smoothly, and obsolete stock has been cleared out. In other cases, planners are under-buffered, suppliers are slow, or the business is losing sales because the right items are not on hand.
A useful review goes beyond the headline ratio:
- Fill rate: shows whether orders ship complete.
- Stockouts: reveal whether the high turn is hiding lost sales.
- Forecast accuracy: shows whether demand planning is improving.
- Gross margin: helps confirm that efficiency is not being bought with discounting.
- Aging and write-offs: show whether old inventory is still sitting in the background.
The point is balance. In a real operation, a turn rate that looks impressive on a slide can still be the wrong outcome if it breaks promise dates, stalls production, or leaves technicians short of parts. The ratio only makes sense alongside service metrics that show whether the stock policy is working.
Reporting the Ratio in Your ERP
A useful ERP report pulls COGS from finance and average inventory from stock records, then ties both to the same period and valuation method. That keeps the calculation grounded in real transactions instead of month-end estimates. In a connected system, the inventory turnover ratio becomes a drill-through report, not a static finance figure.
What each team contributes
- StockFlow records time-stamped receipts, issues, reservations, and deliveries, so the warehouse balance reflects actual movement.
- PurchaseFlow captures orders, supplier receipts, and lead times, which helps explain why stock was built up or reduced.
- SalesFlow provides demand, quotes, orders, and fulfillment history, so you can connect movement to customer activity.
- ManufacturingFlow shows material consumption and production output, which matters when raw materials, work-in-process, and finished goods behave differently.
- FinanceFlow consolidates the period totals so COGS and inventory valuation stay aligned.
SIX CustomerFlow brings leads, opportunities, customer conversations, and next steps into one connected journey, which helps sales teams link customer demand back to stock and fulfillment patterns.
The value shows up at SKU level. A headline ratio can hide one fast-moving item, one obsolete family, or one supplier bottleneck. A good dashboard lets a manager click from the KPI into the underlying receipts, issues, demand spikes, and aging records.
In seasonal or batch-driven operations, the average inventory denominator can distort the picture. A two-point average smooths the peaks, but it can also blur the effect of a bulk receipt, a production run, or a year-end stock build. That is why the KPI needs to sit beside the movement records that created it, not float as a single number on a finance screen.
Here’s the practical rule, if the number changes, the transactions behind it should be visible. That means tying the report to purchases, sales, and production, then reconciling the stock balance to the same valuation method used in finance. When teams review DIO as well, they can see whether a faster turn reflects cleaner flow or just thinner stock. The ratio becomes usable when it points back to the operating events that moved inventory in the first place.
Quick Reference and Next Steps
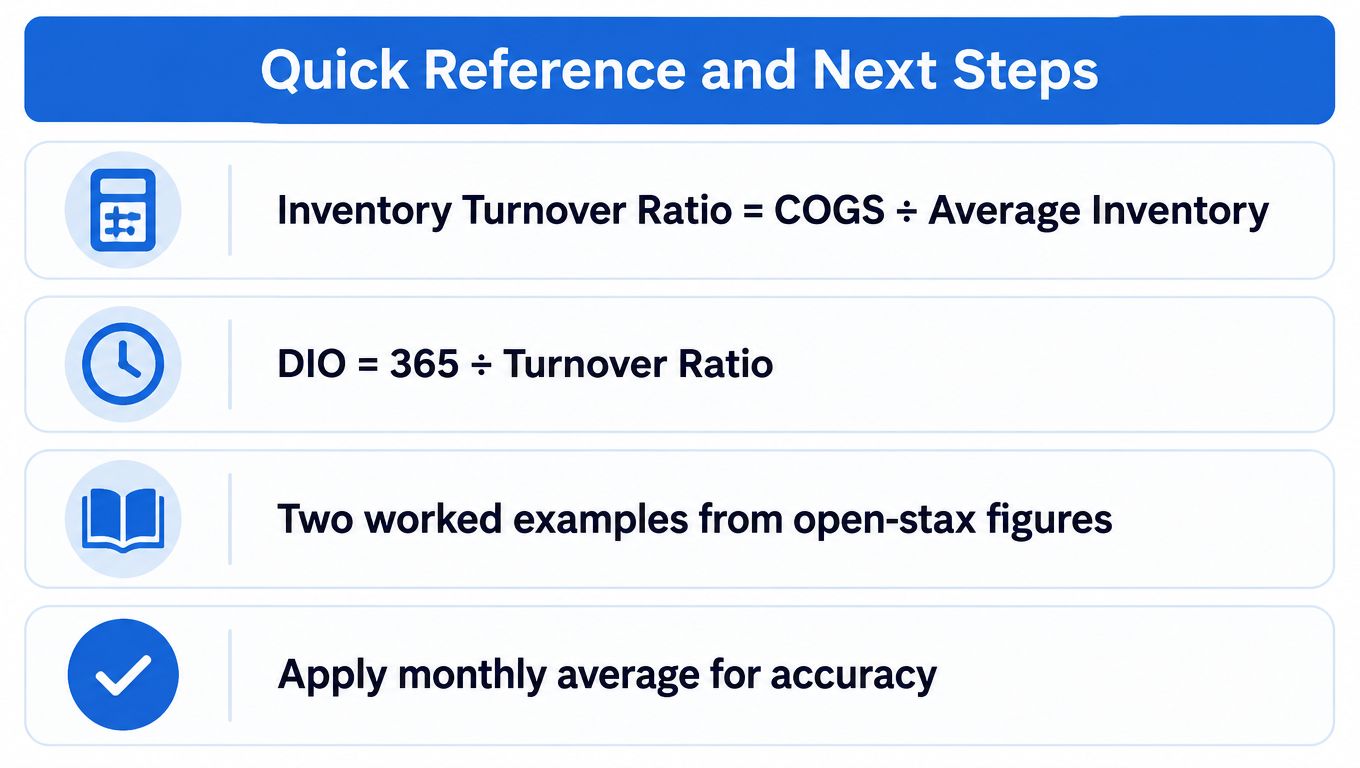
Keep the math in one place. Inventory Turnover Ratio = COGS ÷ Average Inventory, and DIO = 365 ÷ Turnover Ratio. In the finance example, $60,000 COGS against $35,000 beginning inventory and $40,000 ending inventory produces 1.6 turns.
A short working checklist
- Use average inventory carefully: the two-point average works when stock is steady, but it can hide swings when inventory rises or falls sharply during the period.
- Check DIO alongside stock metrics: fill rate, stockouts, aging, and write-offs show whether the ratio reflects tight control or a risk building in the background.
- Compare like with like: keep the same period, the same valuation basis, and the same business model when you benchmark.
- Pull the report monthly: that makes seasonal patterns and batch-driven swings easier to see before period-end closes the gap.
The safest next step is to run the calculation in your own ERP, then compare the result with the warehouse movements and finance records behind it. That is where the ratio becomes useful. For teams using SIX ERP, turnover and DIO can be reviewed against the purchases, production, and stock movements that created them.