


TL;DR - Productivity Through Digitalization
Why do some companies achieve more with the same resources? The answer often lies in better processes, connected information, and smarter use of existing capacity.
In 2025, Bulgaria generated approximately 59% of the EU average value per hour worked on a purchasing-power-adjusted basis. At the same time, ERPAn ERP system connects a company’s core processes—such as sales, finance, inventory, manufacturing, and service—in one place so teams can work with shared information. was used by roughly 26.6% of Bulgarian enterprises, compared with approximately 46.5% across the EU. The two figures describe different populations and must not be read as proof that ERP adoption causes higher productivity. They do, however, raise an uncomfortable question: how much potential output is lost because companies cannot see, coordinate and improve their operations? 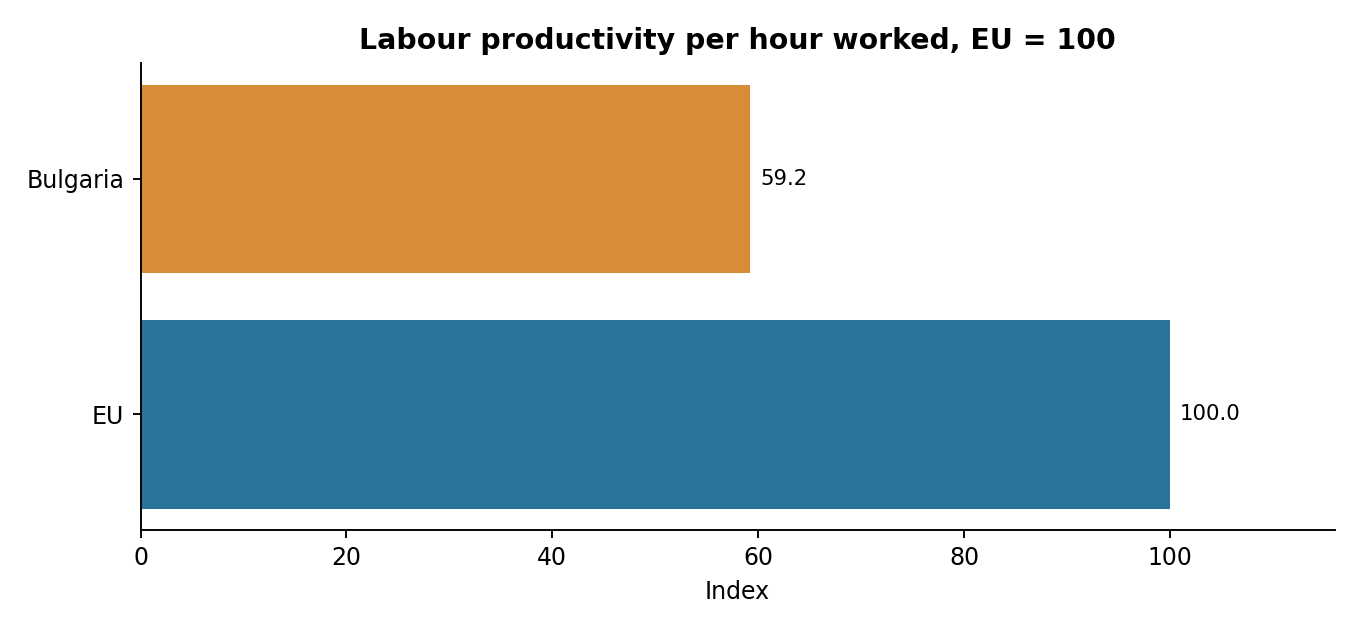
Labour productivity per hour worked is a measure of economic value, not an assessment of how hard an individual works. It is affected by equipment, capital investment, workforce skills, industrial structure and management practices. Bulgaria has made progress over time, but a substantial difference remains compared with the EU average. For a manufacturing manager, the practical question is what share of that gap can be addressed through better planning, fewer interruptions, and more reliable information.
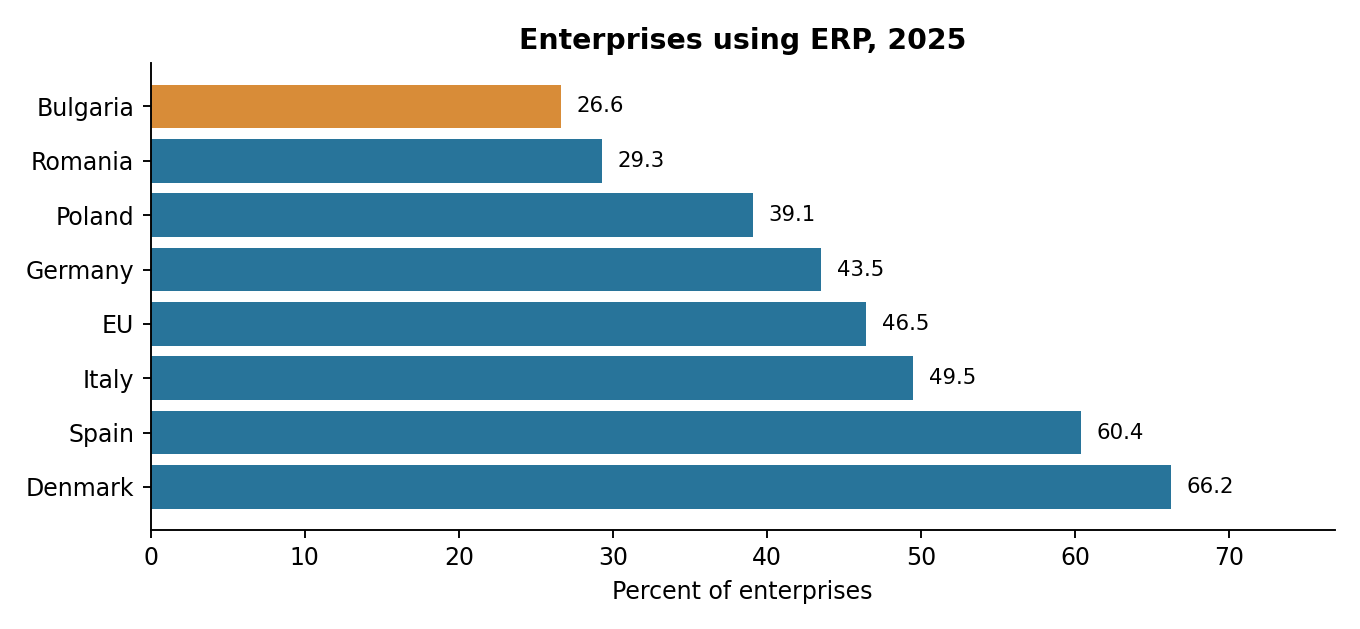
The European ERP comparison reveals marked differences between countries. Bulgaria is below the EU average, while several Western and Northern European economies report much higher adoption. Enterprise size also matters: large businesses are generally much more likely to use ERP than smaller ones. Adoption percentages tell us how common a technology is, not whether the businesses using it achieve a measurable return.
CRM and demand visibility
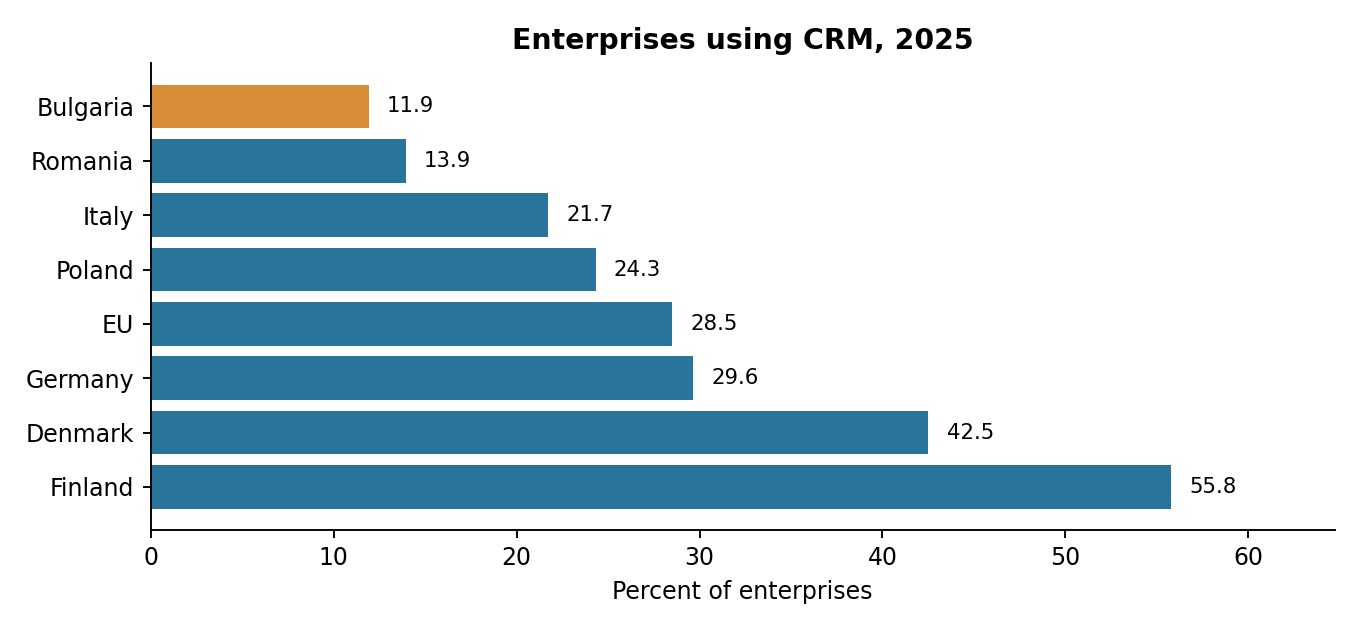
CRM provides a complementary perspective on customer information and demand. Bulgaria also trails the EU average in CRM adoption. For a manufacturer, the operational benefit is not the customer database itself but a more reliable connection between sales commitments, forecasts, stock availability and production planning. A CRM record is useful when it helps prevent an unrealistic delivery promise or an unnecessary production run.
From European Statistics to the Losses Inside a Business
Visible losses include unplanned downtime, defective units and rework. Less visible losses include repeated data entry, chasing approvals, correcting stock records and searching for the latest version of an order. Each interruption may seem minor. Together, they consume labor hours, extend lead times and reduce the capacity available for profitable work. Integrated systems can help expose and address these losses, provided that processes are redesigned rather than merely copied into software.
More output without proportional hiring
A well-designed process can enable the same team to handle more orders or produce more good units. Alternatively, a company may maintain its output with fewer labor hours. The difference is important: greater productivity does not necessarily mean redundancies, but it can reduce labor requirements per unit. Any assessment must include overtime, training, quality and the cost of the system itself.
The First Metrics Worth Measuring
Before implementation, establish a baseline for good units per labor hour, order lead time, scrap, downtime and labor cost per unit. Review these measures after the process has stabilized. OEE can help explain equipment losses, but it is not a universal measure of company-wide efficiency. A digital project should be judged by operational and financial results, not by the number of licenses purchased.
What Do We Really Measure When We Talk About Productivity?
Productivity is not the same as being busy. An employee can remain occupied throughout a shift without the company producing more output or creating more value. In economic statistics, labor productivity is measured as value generated per person employed or per hour worked. At company level, managers can use more operational measures: good units per labor hour, orders completed per employee, value added per worker, or labor cost per unit. The choice of metric matters. Producing more units is not necessarily an improvement if defects rise, delivery times increase, or unit costs deteriorate. A meaningful assessment therefore connects output with quality, time and expenditure.
Productivity must also be distinguished from efficiency. The former concerns the relationship between results and labor input; the latter covers the broader use of machinery, materials, energy and capital. A line may deliver more units per employee while consuming more electricity or generating additional scrap. Successful digitalization should consequently be evaluated against a balanced set of indicators rather than one convenient percentage.
The European Comparison: A Signal, Not an Explanation
The comparison between Bulgaria and the EU reveals a genuine productivity gap, but it does not explain that gap on its own. Economies differ in their industry mix, share of high-value services, capital intensity, investment in machinery, access to markets, company size and workforce skills. When comparing economy-wide productivity with ERP adoption among enterprises employing at least ten people, readers must be told that the two indicators cover different populations.
There is a further risk: a national average cannot predict what will happen inside an individual factory. Two manufacturers in the same industry may have very different product complexity, levels of automationAutomation uses software or equipment to carry out tasks according to defined rules. An ERP system can automate routine business steps and highlight exceptions for review. and operating practices. European statistics should therefore be treated as a starting point for investigation, not definitive proof of the effect of any particular software package. Their value lies in revealing the scale of the differences and directing attention towards management decisions that can actually be measured at company level.
Why ERP and CRM Adoption Is Not Proof of Success
The share of businesses using ERP indicates how widespread integrated management has become, but it does not measure implementation quality. A company may own an ERP system without using it for production, entering data on time or acting on its reports. Conversely, a well-organized company can perform effectively with a narrower toolset. It would therefore be misleading to claim that a country’s higher ERP adoption rate automatically explains its higher productivity.
CRM provides a different perspective. It can improve demand forecasting, customer communication and visibility of incoming orders, but CRM alone does not run a production line. For manufacturers, the greatest value often comes from connecting sales, inventory, purchasing, production schedules and shop-floor execution. That connection turns information held by separate departments into a shared operational picture and allows decisions to be based on the same facts.
A Customer Order as a Test of Operational Coordination
One of the clearest ways to understand integrated systems is to follow a single customer order. A customer requests a quantity and delivery date. Sales checks the commercial terms, production assesses available capacity, the warehouse checks materials and purchasing reviews replenishment needs. If each function relies on a separate spreadsheet, a delivery promise may be made before the business has confirmed that it can meet it. The result can be urgent calls, emergency purchasing and last-minute changes to the production schedule.
With connected information, the response can become faster and more reliable. Software does not replace the planner’s judgement, but it provides a common view of available materials, work in progress, work-center capacity and order priorities. This reduces the likelihood of decisions based on outdated information. The measurable result is not “we installed ERP”; it is fewer late orders, a shorter order-to-delivery cycle and less expensive firefighting.
Production Planning and Lost Capacity
A production line does not lose capacity only when a machine breaks down. It may wait for material, a changeover, a drawing, a tool, quality approvalAn approval is a formal decision that allows a request or action to proceed. An ERP system can route approvals and record who made each decision. or a decision about which order takes priority. These interruptions have different causes and require different responses. If they are all recorded simply as “lost time”, management cannot select the right intervention. Digital reporting becomes useful when it distinguishes causes and helps identify recurring patterns.
Scheduling is especially difficult in environments with short runs, numerous product variants and frequent customer changes. Visibility of materials, capacity and deadlines becomes essential. ERP can support resource planning, while specialized manufacturing tools can capture actual execution. Yet if standard times are wrong or operators do not report operations accurately, the schedule may look precise only on the screen. Digital data must always be checked against what is happening on the shop floor.
For an operational example linking demand, materials and shop-floor execution, see “From Customer Demand to Finished Products” (SIX.ms).
Materials, Inventory and Unit Costs
Material availability is not merely an accounting issue. It determines whether production can start on time and whether an order can be completed without costly interruption. Excess stock ties up working capital, while shortages lead to downtime, emergency deliveries and missed sales. An integrated systemAn integrated system connects business functions or applications so they can share information. An ERP system uses this approach to link operations and reduce repeated data entry. can connect the requirements of production orders with actual warehouse movements and supplier deliveries. Managers then see not only the value of inventory but also the shortage risk associated with a specific production plan.
The same logic applies to product cost. When actual material consumption, labor and machine time are not recorded, a company may believe that a product has a healthy margin even though rework, scrap and overtime erase it. ERP does not guarantee accurate costing, but it can make consistent tracking possible. The management benefit arises when this information changes pricing, process routes or product portfolio decisions.
Quality and Scrap: Not Every Unit Is Saleable
Higher unit counts can create an illusion of productivity if a significant share must be reworked or scrapped. It is more useful to measure good units produced with a given amount of labor and material. Tracking defects by machine, batch, shift and operation can reveal whether the underlying problem concerns settings, raw materials, tooling or instructions. Without traceabilityTraceability follows a product or material through its history, from origin to use or delivery. An ERP system connects the records needed to investigate issues and track affected items., businesses often treat symptoms rather than causes.
Digital systems can shorten the time between a defect occurring and being recognized. When quality information flows promptly back to planning and production, the business may avoid continuing a faulty batch. However, automated data collection will not fix an unsuitable process or poor operating discipline. The strongest results come from combining reliable information, clear accountability and effective corrective action.
OEE: Useful, but Not a Company-Wide Efficiency Score
Overall Equipment Effectiveness, or OEE, combines availability, equipment performance and quality. It helps distinguish losses caused by downtime, running below the expected speed and producing defective units. It is valuable for a machine or production line when data is collected consistently and definitions are clear. OEE does not, however, automatically measure profitability, inventory performance or the productivity of the entire workforce.
A high OEE score can coexist with excessive stock, production of items that customers do not need or unbalanced capacity between work centers. The measure should therefore be considered alongside delivery performance, product cost, scrap and labor productivity. If a company improves OEE without increasing saleable output or reducing expenditure, the economic benefit may remain limited. An OEE chart is useful only when it makes clear what the indicator measures and what it does not.
For a more detailed discussion of downtime and OEE, see “From Downtime to OEE”.
Labor: Fewer Tasks, Not Necessarily Fewer People
One of the most tangible effects of management systems is the reduction of repetitive administrative work. Order information can be entered once rather than copied across several files. Warehouse transactions can be recorded when they happen instead of at the end of the day. Reports can be generated from operational records rather than assembled manually. This releases time, but only if the old parallel procedures are genuinely discontinued.
The hours released can be used in different ways. A company may handle more business with the same team, redeploy employees to quality assurance and customer service, or reduce the need for additional recruitment. Under certain conditions, the number of positions required may also fall. That is not an automatic or universal outcome. The economically meaningful measure is labor input per good unit of output, not the number of people made redundant.
Why Smaller Businesses Need a Different Route
A small manufacturer rarely has a dedicated team of analysts, IT specialists and production planners. One person may perform several roles, while much of the operational knowledge resides in spreadsheets or in the experience of individual employees. This can make the business flexible, but also vulnerable when a key person is absent or orders suddenly increase. Digitalization can begin with the most painful interface, such as the connection between sales, stock and the production schedule.
A small company does not need to copy the operating model of a large factory. A phased implementation may be more sensible: first clean item and inventory data, then orders and planning, followed by more detailed execution reporting. Each phase needs a measurable objective. If the software creates more manual data entry than it removes, the project is not an optimization. Process simplicity, genuine adoption and the ability to scale with the business matter more than the number of features.
Large Enterprises: Integration Matters More Than System Count
Large manufacturers often face the opposite problem: they already have software, but information remains divided among ERP, manufacturing execution, warehousing, quality, maintenance and finance. Each department may have its own version of the truth. This makes analysis difficult and creates hidden reconciliation costs. The benefit of integrationIntegration connects systems so they can exchange information or coordinate actions. An ERP integration helps link business tools and reduce manual transfers between them. comes less from adding another application than from removing inconsistencies between systems that already exist.
Definitions are particularly important: when is an order considered complete, how is downtime measured, which expenses enter product cost and how is scrap recorded? If departments use different rules, even a sophisticated dashboardA dashboard brings key figures and status information together on one screen. An ERP dashboard helps teams monitor performance and identify issues that need attention. can mislead. Large businesses benefit from a shared data model, clear ownership of data quality and regular management reviews. Only then does a complex digital infrastructure become a practical tool for productivity.
Calculating a Real Return on Investment
The economic case should begin before an implementation contract is signed. The business needs a baseline for administrative labor, downtime, scrap, emergency deliveries, inventory discrepancies and late orders. It should then estimate which portion of these losses the project can realistically influence. Not all waste results from missing information; some stems from ageing equipment, unreliable suppliers or skills shortages.
System costs extend far beyond the license. They include configurationConfiguration sets up software using its existing options. In an ERP system, it adapts workflows, roles and other settings to the company’s business processes., integration, data migration, training, a temporary productivity dip during transition, ongoing support and the internal time contributed by employees. A credible business case explains both the expected benefits and the conditions under which they might not materialize. Instead of promising a fixed improvement percentage, it is more useful to show conservative, base and optimistic scenarios, each with clearly stated assumptions.
What Should Happen in the First 90 Days
A practical starting point is not choosing the largest system but identifying one specific problem: excessive order-processing time, unreliable inventory records or frequent material-related downtime. The first weeks should be used to map the process and establish a baseline. A process owner is then appointed, a performance indicator is defined and existing data sources are reviewed.
The next phase tests a limited solution with real users and real orders. The question is not merely whether the software works technically, but whether it removes steps and prevents errors. The final phase compares performance with the baseline and determines whether the approach should be expanded. If no measurable improvement appears, the project should be adjusted rather than celebrated simply because it was delivered on schedule. This discipline reduces the risk of expensive digitalization without economic value.
What an Illustrative Scenario Shows, and What It Does Not
Consider a company producing 10,000 good units per month with 100 employees, or 100 units per person. If changes to planning, purchasing and reporting allow the same volume to be completed with 80 employees, output per employee rises to 125 units: a 25% improvement at unchanged total output. Alternatively, if the workforce remains at 100 and produces 12,500 good units, productivity also rises by 25%. The two outcomes have very different implications for staffing and revenue.
This is an arithmetic scenario, not evidence of the average impact of ERP. A real company must check that reduced labor input does not lead to more overtime, defects or excessive workloads. Headcount alone is also insufficient: hours worked provide a more accurate measure because shifts and contract patterns can distort comparisons. The scenario is useful when it teaches readers how to calculate an effect, not when it suggests every business will achieve it.
Five Metrics Management Should Track
The first indicator is good output per hour worked. The second is the order-to-delivery cycle, because speed without reliable delivery is of limited value. The third is the share of scrap and rework. The fourth is unplanned downtime broken down by cause rather than presented only as total minutes. The fifth is labor cost per good unit. Together, these measures provide a more realistic picture than a single digital maturity score.
Each metric needs a clear definition, an owner and a review frequency. If one department reports units manufactured and other reports units shipped, results will not be comparable. Seasonal changes must also be distinguished from lasting improvement. A management system creates value when it reduces the time between a problem arising, being identified and being corrected. The mere existence of a dashboard is not an outcome.
The Workforce After Digitalization: Risk and Opportunity
Reducing labor requirements can mean fewer new hires, redesigned roles, redeployment or an actual reduction in positions. The appropriate decision depends on demand, finances and employee skills. An article promising widespread job cuts after ERP adoption would be both unsupported and managerially simplistic. In some businesses, higher productivity enables growth without a proportional increase in headcount; that may be the more sustainable outcome.
Transition costs must also be recognized. Employees need training, while some roles become more analytical and less repetitive. If a system is presented solely as a surveillance or redundancy tool, resistance may undermine data quality and adoption. Good management therefore explains how work will change, which skills will matter and how success will be evaluated. Productivity is an economic objective, but achieving it depends on people.
When an Implementation Can Fail
A common mistake is to digitize disorder. If items have inconsistent codes across departments, standard times are unreliable and responsibilities are unclear, a new system may simply expose the problems more visibly. Another mistake is introducing too many functions at once before users have mastered core tasks. The result can be parallel work in old spreadsheets and new software: more labor rather than less.
Failure is also possible when a project is judged only by technical milestones: the system is installed, data has been migrated and users have access. None of this proves that the business operates better. Clear operational objectives and regular comparisons with the baseline are essential. If expected benefits do not materialize, causes must be examined openly: poor process design, inadequate training, inaccurate data or an inappropriate scope. Critical evaluation is part of responsible investment.
For a practical discussion of selection, data migration and implementation risk, see “Choosing and Migrating ERP.”
The Strategic Implication for Bulgaria
European statistics do not prove that software alone will close the productivity gap between Bulgaria and more advanced economies. They do, however, reveal substantial differences in both values generated by labor and the use of integrated management systems. For Bulgarian companies, that is a reason to examine their own operations rather than treat international percentages as a ready-made recipe.
The strongest argument is practical: when information about orders, materials, equipment and labor is reliable and connected, managers can identify losses sooner and take corrective action. This creates opportunities for more good output per hour worked, lower labor intensity and growth without continually expanding the workforce. Under certain conditions, the number of positions required may decline. Whether that happens depends not on the system’s name but on the company’s processes, investment decisions and management capability.
How to Read the Data
Productivity statistics describe economic output at country level; they do not measure the effort of an individual employee. ERP and CRM statistics describe technology adoption in the surveyed business population, not the measured impact of implementation. Numerical staffing and output examples in this article are illustrative arithmetic scenarios, not representative estimates of ERP benefits. Differences between countries cannot establish causation. Figures may be revised by the statistical authorities; check the latest official series before publication.
Conclusion: Less Waste, More Value
Management systems are not a magic solution. A poorly designed process does not become efficient simply because it has been transferred into ERP. Yet a system that links reliable data with clear responsibilities can help a company reduce waste, improve planning and generate more output with the resources it already has. The central question is no longer only where to find more people; it is how much more a business can achieve with the people it already employs.