

TL;DR - Demand Planning vs. Supply Planning
Two different planning processes, one shared goal: meeting customer demand without unnecessary inventory, costs, or production delays.
What happens to a forecast error after the forecast has been approved? Most comparisons of demand planning vs supply planning stop at the definitions and never follow the number. A forecast gets signed off in a sales meeting, someone copies it into a production plan, and the error travels from there into purchase requests, work orders, warehouse shelves and the cash tied up in all three. Nobody owns it at that point, because ownership was defined by department rather than by handoff.
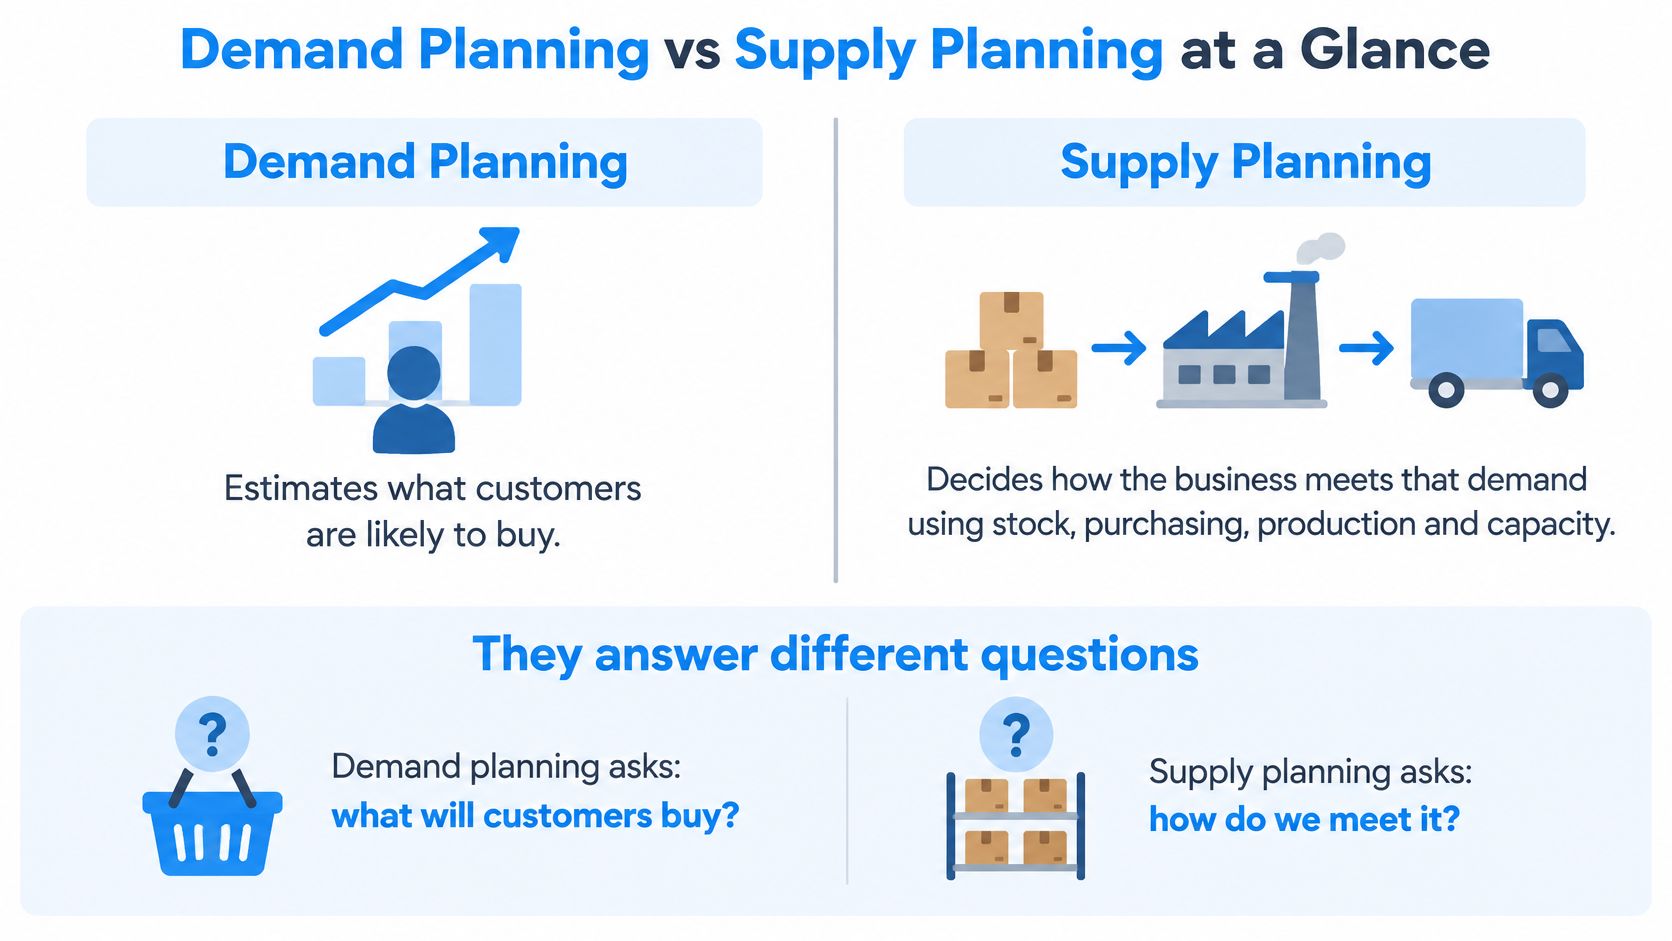
The two disciplines answer different questions. Demand planning estimates what customers are likely to buy. Supply planning decides how the business meets that demand through stock, purchasing, production and capacity. This guide follows one plan into the other, names who owns each step, and shows which metric catches a bad number before it becomes excess stock or a missed delivery.
Demand Planning vs Supply Planning at a Glance
Demand planning and supply planning are separate disciplines that solve one coordination problem. Demand planning estimates what customers may need, drawing on forecasts, sales history and confirmed orders. Supply planning determines how the business can meet that need through available inventory, purchasing, production and capacity. One looks outward at the market. The other looks inward at what the business can commit to.
The two are managed independently so each department can own its process while still coordinating decisions with the wider business.
Use of the two practices is uneven. In 2025, demand planning was used by 55% of surveyed small and medium-sized businesses, up from 44% in 2024, according to Netstock’s global supply-chain planning benchmark. The companies outside that number still take orders, buy materials and ship products. Their supply side reacts to incoming orders instead of planning ahead of them.
Ownership usually follows proximity. Demand planning sits with sales or a dedicated demand planning team, because the people talking to customers hold the market knowledge. Supply planning sits with procurement and production planning, because those teams control the commitments that cost money.
| Aspect | Demand planning | Supply planning |
|---|---|---|
| Core question | What will customers likely need? | How can the business meet that need? |
| Typical owner | Sales or demand planning team | Procurement and production planning |
| Main inputs | Sales history, confirmed orders, market signals | Inventory, supplier lead times, bills of materials, capacity |
| Main output | Forecast by item, location and period | Purchase, production and replenishment plan |
| Planning focus | Forecast accuracy and bias | Material availability, delivery and schedule adherence |
Ownership structures vary by company, and SIX ERPAn ERP system connects a company’s core processes—such as sales, finance, inventory, manufacturing, and service—in one place so teams can work with shared information. lets each business assign its own approvalAn approval is a formal decision that allows a request or action to proceed. An ERP system can route approvals and record who made each decision. and ownership roles to fit its organization, so the split follows how the company operates rather than a fixed template.
Which of three describes your business: one shared plan, two separate plans that meet in a monthly spreadsheet, or no formal plan at all? The answer decides what to fix first.
Why Demand Comes First and Supply Follows
Demand planning asks how many finished products or services the market may require. Supply planning asks a narrower question. Given that requirement, what must be bought, produced, stored and scheduled, and when? The second question can’t be answered until the first has a number attached to it.
Following One Requirement Through Four Steps
Take a production plan that calls for 100 finished units, where each unit uses 4 components. The gross component requirement is 400 before inventory, scheduled receipts, scrap or safety stock are considered. The arithmetic runs in four steps.
- Confirm the finished-goods requirement. 100 units, dated to the week the market needs them.
- Multiply by the bill-of-materials quantity. 100 units × 4 components gives 400.
- Subtract what’s already available. Usable stock plus open receipts reduces 400 to a net requirement.
- Back-schedule the dates. Supplier lead times and production run times set the purchase order and work order dates, not the other way round.
This is material requirements planning, and manufacturers have automated it since computers became available in the late 1950s and early 1960s, working backward from a finished-goods schedule through the master production schedule, bill of materials, open orders and supplier or production lead times. Industrial implementations in the early 1960s included work at J.I. Case, a tractor manufacturer, and the method spread through the APICS “MRP Crusade,” formally launched in 1971 (MIT).
The lasting insight is dependent demand. A component doesn’t need its own forecast when its requirement follows from a higher-level product and a bill of materials. Component-level forecasting is how a supply team ends up with figures that look reasonable and don’t add up to the finished product.
Practical rule: Ground the demand plan as close as possible to actual end-customer consumption, and keep the supply plan aware of inventory already in the pipeline and the time needed to replenish it.
That rule exists because order volumes swing hard while consumption stays flat. A 1997 MIT Sloan study described how Procter & Gamble saw relatively stable consumer diaper consumption while orders grew more variable as they moved upstream through retailers, distributors and manufacturers, the pattern known as the bullwhip effect (MIT Sloan Management Review). The cost lands as excess inventory, shortages, expedited freight and repeated plan revisions.
In a connected system, those four steps live in one place. SIX ManufacturingFlow plans manufacturing orders and coordinates machines, employees, materials and BOMs, so a change to the finished-goods quantity moves through to the component requirement instead of sitting in a separate spreadsheet.
Inputs Each Plan Needs and Where SIX ERP Stores Them
Who owns the number both plans will treat as true? A forecast is a judgment held by demand planning. A supply plan is a set of commitments held by procurement and production. The usual break is a field one owner updates and the other never reads.
| Record | Owner | Field the other plan must read | Where SIX ERP keeps it |
|---|---|---|---|
| Sales history | Demand planning | Quantity sold, by item and week | Order history behind the forecast |
| Confirmed customer order | Sales, read by supply | Reserved quantity and quantity still open | Order tied to stock and to the supply response |
| On-hand and reserved stock | Warehouse | Available quantity after reservations | Inventory balances |
| Open purchase order and receipt | Procurement | Quantity ordered, quantity received, promise date | SIX PurchaseFlow orders and deliveries |
| Supplier lead time | Procurement | Days from request to receipt | Supplier record on the same purchase flow |
| Bill of materials and routing | Production | Component quantity per parent, and the work steps | Manufacturing BOMA Bill of Materials (BOM) lists the materials and components, and their quantities, needed to make a product. and routing data |
| Promotion and seasonality | Demand planning | Uplift that history alone will not show | Planner notes kept with sales history |
| Work-centre capacity | Production | Available hours and batch size | Capacity data on the work centre |
| Minimum order quantity and safety stock | Supply planning | Smallest buy or make quantity, plus the buffer | Item master stored with stock data |
Purchasing turns a demand signal into a supplier commitment, so the purchase record has to keep the item, quantity and date that demand planning just changed.

Three shared records get the least review: the item master, the locations where stock is held and sold, and the planning calendar of working days, holidays and review cycles. Put the wrong unit of measure on the item master and both plans move, in different directions, off one correction.
Why an Accurate Forecast Can Still Fail
A bakery forecasts 500 loaves for the week. Ovens run in batches of 240, so the smallest sensible run above 500 is three batches, 720 loaves. Flour arrives once a week, which fixes the buy to delivery day rather than forecast day. A forecast of 500 can be statistically sound and still unusable, because nothing in it knows the batch size or the delivery window.
Leave out minimum order quantities, batch sizes, capacity calendars or component constraints and the forecast can score well while production cannot run it. A supply plan can also hit its schedule every week and still build the wrong mix.
The confirmed order is the handoff. It reserves stock so the same quantity is not promised twice, and it shows whether the shortfall must be purchased, manufactured or transferred. Cut that order from 500 loaves to 320. Sales owns the new confirmed quantity, and the reservation falls with it. Production owns the batch rule, so the run drops from three batches to two, 480 loaves. Procurement owns the flour request, which is rewritten from 480 rather than left at 720. One quantity change, three owners, and both plans read the revised figure instead of a private spreadsheet.
KPIs to Track Separately and Together
A forecast error does not stay inside the demand plan. When the forecast overshoots, procurement commits to materials no customer ordered. When it falls short, the same miss reappears weeks later as a component shortage on the supply planner’s dashboardA dashboard brings key figures and status information together on one screen. An ERP dashboard helps teams monitor performance and identify issues that need attention.. Separate scorecards exist so each stage of that journey has a named owner, and so the error gets caught before it crosses the next handoff.
| KPIA KPI (Key Performance Indicator) measures progress towards a business goal. An ERP system can calculate KPIs from business records and show changes in performance over time. | Plan | What It Shows | Warning Sign |
|---|---|---|---|
| Forecast accuracy (MAPE or WAPE) | Demand | How close the forecast is to actual sales | Error trend worsening over several review cycles |
| Forecast bias | Demand | Whether the forecast consistently over or under predicts | Persistent positive or negative bias |
| Actual orders vs forecast | Demand | Gap between confirmed demand and plan | Large gaps on high-volume items |
| Material availability | Supply | Share of required components on hand when needed | Shortages found after production starts |
| Supplier on-time delivery | Supply | Reliability of inbound supply | Repeated late receipts from the same supplier |
| Production plan adherence | Supply | How closely production follows the schedule | Frequent unplanned schedule changes |
| Inventory coverage | Supply | Stock available against expected demand | Coverage falling below policy levels |
| Stockout risk | Supply | Likelihood that an item runs out before replenishment | Rising risk on high-margin products |
What Each Group Actually Tests
Demand-side metrics test the judgment about the market. Forecast accuracy at item, location and week level exposes errors that monthly totals hide, because a healthy aggregate can sit on top of a dozen offsetting item-level misses. Forecast bias shows whether planners are consistently optimistic or pessimistic, a pattern that points to a problem in the planning process itself. The orders-versus-forecast comparison shows where the plan and the order book have parted company.
Supply-side metrics test whether commitments can be kept. Material availability asks whether components are on hand when production needs them. Supplier on-time delivery isolates inbound reliability from everything else that can go wrong. Plan adherence and inventory coverage show whether the schedule holds and whether stock lasts to the next receipt. Stockout risk flags the items where a shortfall would hurt margin most.
Read side by side, the two columns also trace an error’s path. A bias that starts on the demand side resurfaces later under supply names: purchase orders nobody needed, inventory coverage climbing past policy, stockout risk rising on items the forecast undercalled. A team that reviews only its own column sees a symptom. A joint review sees where the error entered.
The gap between the scorecards is wide. In 2025, only 29% of surveyed supply-chain executives said their demand and supply forecasts were at least 80% accurate on average, as Indago’s survey reported by Talking Logistics shows. Most surveyed executives therefore plan on forecasts they do not rate as reliable, which is why the shared measure carries more weight than either headline score.
The Measure Both Teams Share
The shared question is whether approved demand gets delivered on time at inventory levels the business can afford. Answer it monthly by reading forecast, orders, inventory, planned receipts, capacity and expedite cost in one review, then escalating only the exceptions that touch service, margin or cash.
Where planning data sits across several systems, the reporting layer becomes a project of its own. Teams running SAP alongside a lakehouse often need help connecting SAP, Fabric and Databricks before this KPI set can be calculated from a single source of truthA single source of truth is an agreed set of authoritative business information. An ERP system helps teams use consistent records across departments and processes..
Material availability, the supply KPI most exposed to late demand signals, has to work as an active control. SIX ManufacturingFlow checks availability before production begins, allows reserving required components and identifies shortages early, so the shortage surfaces while there is still time to react.
How the Two Plans Interact Inside an ERP
Inventory buffers are getting thinner, which leaves less room for a slow handoff. In 2024, 34% of global supply-chain leaders reported relying on larger inventory buffers to manage disruptions, down from 59% previously, according to McKinsey & Company. A company that once absorbed a planning error with stock now feels it in the schedule.
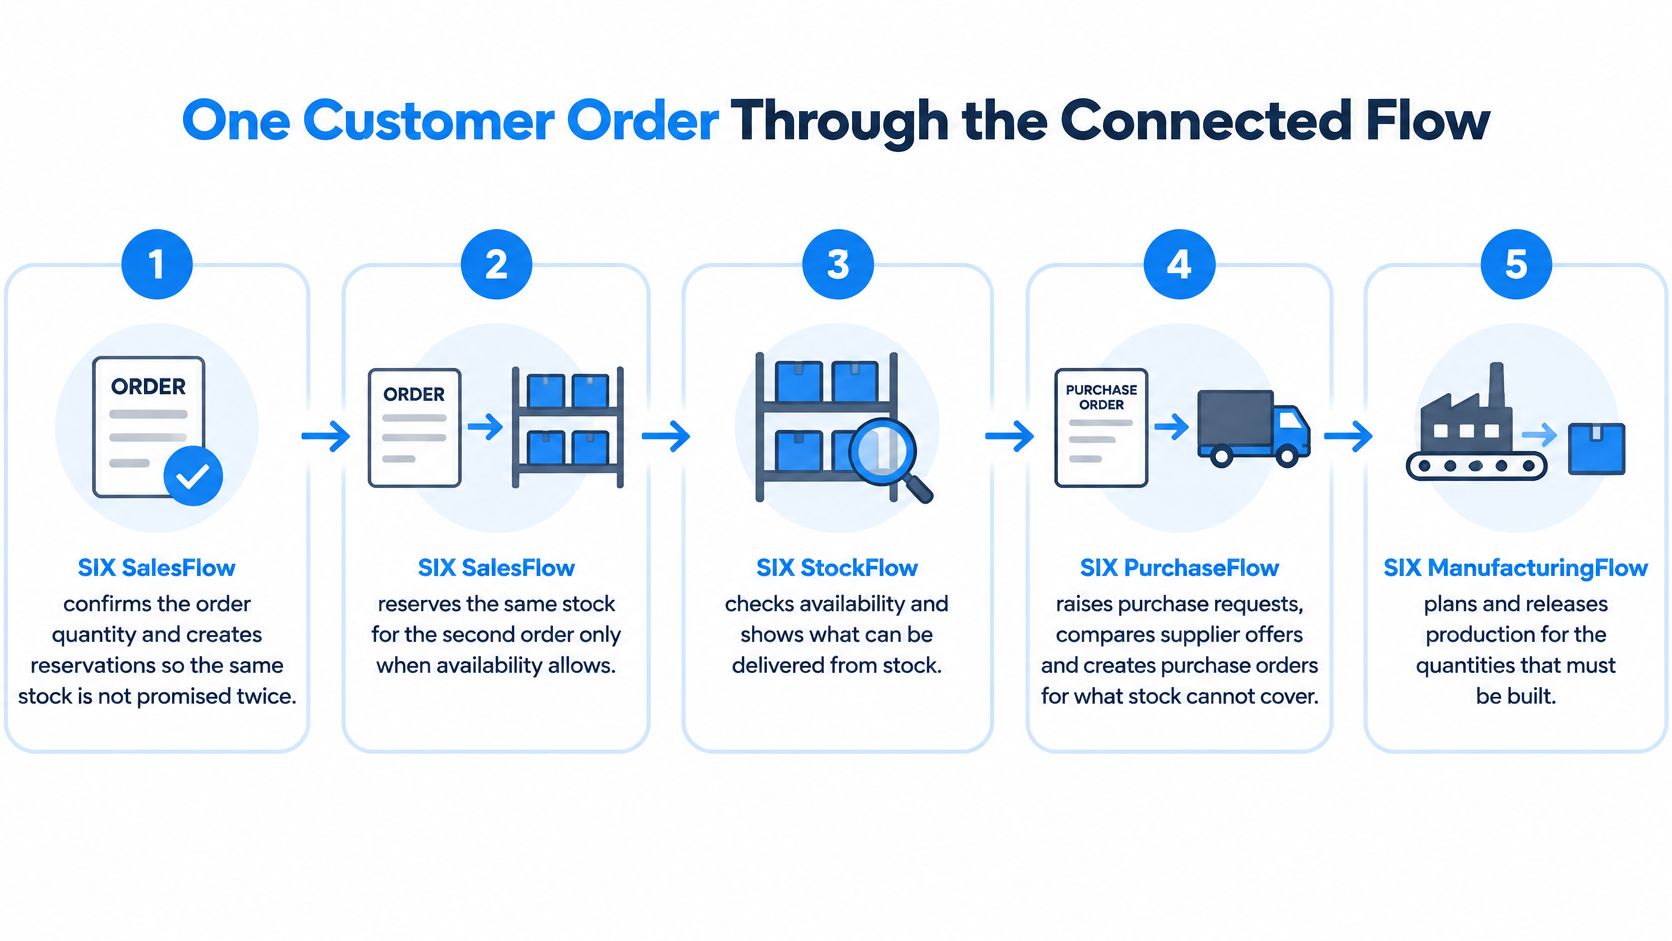
Here is how one confirmed order moves through a connected system.
One Order, Six Handoffs
- Confirm and reserve. SIX SalesFlow confirms the order quantity and creates reservations, so the same stock isn’t promised to a second customer. Sales owns the confirmed commitment from this point.
- Decide how to fulfill. The same record compares requested quantities with available, reserved and expected stock and identifies whether the product must be purchased, manufactured or transferred. This is the decision point where a demand signal becomes a supply task.
- Apply the right production trigger. Make-to-stock items are produced from forecasts and replenishment rules. Make-to-order items are produced only after a confirmed customer order. The trigger decides which plan leads.
- Raise the response. Shortages become purchase requests or manufacturing orders, each routed through its own approvals. Supply owns this step, and the purchase order or work order is the record of that ownership.
- Receive and consume. Deliveries update stock, consumed components are deducted, and the order status moves forward with the quantities that remain open.
- Close the loop in finance. Delivery and invoicing connect to revenue, margin and any expedite cost the shortage caused.
Every step above has a named owner, and the exception needs one too. A shortage nobody owns bounces between sales, purchasing and production until the customer notices, and by then the cheapest fix is already gone.
The full path from a customer commitment to a finished product is covered in this walkthrough of the demand-to-production flow.
Choosing the Right Focus in Real Situations
Planning advice usually assumes the forecast comes first and supply reacts. That assumption fails for a large share of real items. When a supplier can’t ship a key raw material, or a customer orders a configured product that has never been built, the constraint or the order leads and demand planning adjusts around it.
| Situation | Lead Plan | Check First | Common Mistake |
|---|---|---|---|
| Stable item with a year of sales history | Demand planning, supply follows | Forecast bias and lead times | Over-tuning a model that already works |
| New product with no sales history | Demand assumptions, reviewed often | Launch assumptions and customer signals | Trusting a complex model without data |
| One-time bulk order | Demand planning removes it from the baseline | Order classification in the history | Treating one-off orders as recurring demand |
| Supplier shortage on a key raw material | Supply planning | Alternate suppliers, lead times and stock cover | Ignoring the downstream demand impact |
| Make-to-order product | Supply planning starts after the confirmed order | Customer order and material availability | Building stock on a forecast |
| Hybrid production | Both, split by stage | Which parts are made for stock and which wait for orders | Mixing stock and order triggers |
A shortage in raw materials is the clearest case of supply leading. In a hypothetical case, a resin supplier cuts its allocation mid-quarter, and a manufacturer has to qualify an alternate source, accept a longer lead time and stretch remaining stock across the orders already promised. Demand stays the same. The plan that has to move is the supply one, and it moves by finding cover rather than by reforecasting. In SIX ManufacturingFlow, material availability can be checked before production begins, components can be reserved for the orders that need them, and shortages surface early enough to act on them.

A Bulk Order That Looked Like Growth
A manufacturer’s forecast overstated demand for one product because a one-time bulk order was treated as recurring sales. This is a hypothetical example. The inflated number travelled through the handoff: extra purchase requests went to procurement, extra production orders went to the floor, and excess finished goods and components reached stock before anyone questioned the pattern. Each downstream team had executed a valid step against an invalid input, and no single owner sat on the error. The team reviewed order history, separated one-off orders from recurring demand, adjusted the forecast against recent sales and confirmed orders, and began checking forecast accuracy every month instead of at quarter end.
The correction was a data decision. Removing the bulk order from the baseline changed the number more than any algorithm choice would have, and assigning an owner to order classification kept the same mistake from returning.
Products with no history need a different discipline again. There’s nothing to fit a model to, so the work becomes building an auditable assumption set: the expected launch volume, where the estimate came from, and the evidence that would change it. The measures that matter are launch service level, stockout rate, inventory exposure, bias direction and how fast the team detects a bad assumption.
New products need evidence before they need forecasts.
Hybrid production splits the question rather than answering it once. Standard components and semi-finished goods can be produced for stock, while final assembly or customizationCustomization changes or adds software functionality beyond standard settings. In an ERP project, it can meet specific business needs while adding development and maintenance work. begins only after a customer order, and the MTO and MTS comparison shows how the two triggers coexist without confusing the stock position.
Tools and Helpers Each Plan Relies On
Tools don’t plan. Planners plan, and tools hold the arithmetic. The right question when choosing one is which decision it exists to support and which data that decision depends on, because a tool fed the wrong inputs produces confident, wrong answers either way.
| Tool or Helper | Mainly Used By | Strength | Limitation |
|---|---|---|---|
| Statistical forecasting models | Demand planning | Finds repeatable patterns in sales history | Weak with short history or sudden shifts |
| AI-assisted forecasting helpers | Demand planning | Detects patterns across many variables | Output needs review against orders and market knowledge |
| Mathematical planning helpers | Supply planning | Calculates requirements from set rules and data | Accuracy depends on clean master data |
| Material requirements planning netting | Supply planning | Applies the netting logic described earlier | Breaks when bills of materials or lead times are outdated |
| Capacity and work-centre loading | Supply planning | Shows whether machines and staff can deliver | Needs realistic capacity data |
| Monthly S&OP review | Both teams | Aligns assumptions and exceptions | Depends on consistent participation and decisions |
Statistical forecasting models are the right default for mature items with two or three years of clean data. They weaken when history is short or when demand shifts for a reason the model has never seen.
AI-assisted forecasting helpers examine many variables at once and pick up patterns a planner would miss across channels, regions or variants. The output still needs review against confirmed orders and market knowledge, because a detected pattern describes what happened, not why it happened.
Mathematical planning helpers calculate requirements from bills of materials, lead times and current stock, using the netting logic covered earlier. Their accuracy is a function of master data quality, and outdated lead times produce confident, wrong dates. Capacity and work-centre loading answers whether machines and people can deliver the plan at all, which only works with realistic changeover, maintenance and shift data behind it.
The monthly S&OP review aligns assumptions and exceptions across both teams. It works when the same people attend and decisions get recorded, and it fails when each side presents its own numbers to an audience that can’t change them.
Inside SIX ERP, these helpers read from shared records rather than separate extracts. SIX SalesFlow compares requested quantities with available, reserved and expected stock and identifies whether unavailable products must be purchased, manufactured or transferred. SIX ManufacturingFlow checks material availability, machine capacity, employee skills and work-centre workload before production begins. The shared data cuts both ways: a demand error written once on the sales side travels into purchase requests and production orders along the same records, so ownership of the forecast matters as much as the algorithm behind it.
A rule that saves rework: choose the tool after you’ve defined the decision, the data owner and the threshold that triggers a review.
Safety stock sits underneath all of this. The safety stock formula explained covers how much buffer each service level requires.
Set Ownership and Shared Rules Before Your Next Cycle
Ownership gaps don’t close themselves. They close when a company writes down who decides, what’s shared, and when an exception escalates. Five steps set that up before the next planning cycle.
- Name two owners. One for demand planning, one for supply planning. Record who approves a change to either plan, and who can overrule.
- Split the assumptions. List what’s shared, such as the planning calendar, item master and locations, and what stays function-specific, such as promotional lift on one side and capacity scenarios on the other.
- Set exception thresholds. Define the shortage, late supply, overloaded capacity and inventory risk levels that trigger escalation, and name the person each one goes to.
- Book one monthly review. Compare forecast, orders, inventory, planned receipts and capacity in a single meeting with a written record of decisions.
- Adjust after the first cycle. Keep the thresholds that caught real problems and raise or lower the ones that produced noise.
The point of the split isn’t departmental independence. It’s that each side can defend its own numbers before they’re reconciled, so the reconciliation becomes a decision instead of an argument about whose spreadsheet is right.
Start with the flow that already holds the data. If purchasing is where your planning decisions land, map request through approval to delivery first, then connect the demand side to it. To talk through which path fits your business, book a conversation through the ‘Plan your next step’ button and tell us whether you’re planning, implementing or already running an ERP environment. Our consultants help identify the right service path and explain the next stage.
SIX ERP connects sales, purchasing, inventory, manufacturing and finance in shared workflows, so a confirmed order, a purchase commitment and a production order all point at the same records instead of three versions of the truth. Roles, approvals and exception thresholds are configured around how your teams work, which is what keeps demand and supply planning separate in ownership and joined in data. Visit SIX ERP to see how that fits your process, or start with the flow that holds your planning data and work outward from there.