

You have two quotes on the desk. Supplier A is 4% cheaper, and it has missed its confirmed date on roughly every second order for six months. Supplier B costs more and delivers complete and on time. The price list favors A. Your goods receipts say otherwise. This situation highlights the importance of a supplier performance scorecard when making procurement decisions.
That gap is what a supplier performance scorecard closes. It turns records your business already creates, such as purchase orders, goods receipts, inspection results and invoices, into one comparable view of how a supplier behaves. Not a ranking exercise, and not a yearly argument about impressions. A scorecard is a decision trigger: it tells you when to talk to a supplier, when to change a planning assumption, and when to qualify someone else.
what follows covers the indicators worth tracking, the formulas behind them, how to weight and gate a score, and the harder question most guides skip. How do you score a supplier when the data is incomplete, self-reported, or hides a concentration risk?
Supplier KPIs, Formulas and Benchmarks
Supplier A quotes EUR 9.60 per unit. Supplier B quotes EUR 10.00, a 4% premium. Add the cost of A’s late orders, including expedited freight, idle line time, rework and rescheduling. If that friction costs EUR 0.90 per unit, A’s landed cost is about EUR 10.50. The lower quote is not the lower-cost option.
A supplier scorecard combines several KPIs to make that comparison useful. Research published in 2021, based on 147 buyer-supplier responses, found that diagnostic use of performance measures and interactive use through discussion and joint problem-solving both improved supplier performance, through different routes. Interactive use worked partly through relationship trust, while mechanical diagnostic use could weaken trust, according to the Penn State study of measurement system use and relationship trust.
Every score should prompt a decision or a conversation. A ranking without a response plan is just a report.
The seven measures that carry most of the weight
| KPIA KPI (Key Performance Indicator) measures progress towards a business goal. An ERP system can calculate KPIs from business records and show changes in performance over time. | Calculation | Good | World-class | Operational consequence |
|---|---|---|---|---|
| On-Time Delivery (OTD) | Receipts on or before the confirmed date ÷ total receipts | 93-96% | Above 98% | Late material stops production orders |
| On-Time In-Full (OTIF) | Orders complete and on time ÷ total orders | 90-94% | Above 97% | Short shipments cause partial builds |
| Quality Acceptance Rate | Accepted units ÷ received units | Above 99% | Above 99.9% | Rejections trigger inspection and returns |
| Defect Rate (PPM) | Defective units ÷ received units × 1,000,000 | Below 10,000 PPM | Below 1,000 PPM | Rework and line stoppages |
| Lead-Time Adherence | Actual lead time ÷ agreed lead time | Within 10% of agreed | Within 2% of agreed | Wrong planning dates and extra safety stock |
| Price Variance | (Invoice price minus agreed price) ÷ agreed price | Within 1% over agreed | At or below agreed | Unbudgeted cost and margin erosion |
| Responsiveness | Average hours to acknowledge and close an issue | Acknowledged within 24 hours | Acknowledged within 4 hours | Slow shortage recovery and open corrective actions |
Treat these bands as starting points, not promises. Set targets against the supplier’s role, material criticality and your own operating requirements. For measures without a useful external benchmark, define an internal threshold and review it as performance and requirements change.
Why four to eight KPIs, not twenty
Supplier performance has several dimensions, which all reflect in the supplier performance scorecard. A study of 304 manufacturing plants across four Asian countries, using observations collected during 2013 to 2015, examined supplier assessment, long-term relationships, quality involvement, logistics integrationIntegration connects systems so they can exchange information or coordinate actions. An ERP integration helps link business tools and reduce manual transfers between them., lead-time reduction and joint development in relation to quality, delivery, flexibility and cost. It reported a positive relationship between supplier relationship management and operational performance, as described in the study of supplier relationship management and competitive performance. A price-only score misses delivery, quality and other operating effects.
Four to eight indicators per supplier segment is a practical working range. Too many measures make reviews cumbersome; too few can hide a failure that matters. Choose KPIs that can change a decision, such as rescheduling production, qualifying another source or opening corrective action.
Supplier identity can undermine every calculation. If one vendor appears under several spellings, transactions may split across records and distort the result. The NanoPIM vendor management guide discusses keeping vendor records, onboarding and document trails organized. To assess whether a supplier can support a new line or a volume increase, see the guide to moving from business need to supplier delivery.
How ERP Records Feed Each Supplier Score and How to Score Incomplete Data
A scorecard isn’t a form you fill in. It’s a by-product of records that already exist in your system, and a practical build follows a controlled workflowA workflow defines the steps, responsibilities and decisions needed to complete work. An ERP system can guide tasks through these stages and show progress. rather than a spreadsheet habit.
The chain, link by link
- Purchase order: expected quantity, agreed price, confirmed delivery date, supplier ID.
- Goods receipt: actual receipt date and received quantity.
- Quality inspection: accepted and rejected quantities, with defect reasons.
- The scorecard: calculated from those linked records, never keyed in by hand.
- Corrective-action record: opened when a threshold breaks, with an owner and a due date.
The join is the hard part. Supplier ID has to match across orders, receipts, inspections and invoices. When it doesn’t, the score drops transactions, and you’ll never spot which ones.
Each link needs one handling rule. Partial deliveries are scored against the confirmed date for the quantity delivered: an order for 1,000 steel brackets confirmed for 3 March that arrives as 600 on 3 March and 400 on 6 March counts 600 on time and 400 late, so the order fails OTIF. Approved date changes reset the agreed date and leave an audit trailAn audit trail records who created, changed or approved information and when. In an ERP system, it helps trace transactions, investigate errors and support audits. of who approved it. Returns and posting errors get corrected before scoring, not after. Internally caused delays, such as a late production release, are tagged as internal and excluded from supplier OTD.
The published guidance on procurement KPIs and reporting formulas lays the sequence out well: define the objective and supplier segment, select roughly 4 to 8 KPIs, and give each one a formula, target, threshold, owner, reporting period and authoritative data source. Set a historical baseline, weight by business criticality, calculate from transactional systems, review operational indicators monthly and strategic ones quarterly, and tie every miss to a named corrective action. The same reference is a workable public source for the benchmark bands used earlier.
Scoring when the data isn’t there
Missing data is where most scorecards go wrong. A blank scored as zero punishes a supplier that didn’t report, and a blank scored as neutral rewards one with a large compliance team and slow deliveries.
| Data status | What it means | How the scorecard handles it |
|---|---|---|
| Verified | Confirmed from ERPAn ERP system connects a company’s core processes—such as sales, finance, inventory, manufacturing, and service—in one place so teams can work with shared information. transactions or audit records | Score normally and show the evidence date |
| Self-reported | Submitted by the supplier and not yet checked | Score with a confidence flag until reviewed |
| Estimated | Calculated by the buyer from a proxy measure | Score and label clearly as an estimate |
| Not received | No response and no data from the supplier | Track on a separate supplier-engagement metric, not as zero |
Evidence older than one review period loses confidence. Externally supplied ESG or compliance data stays unverified until someone reviews it. The measurement gap is real in published filings: in 2025, Polaris reported that only 53.8% of its 2,351 in-scope suppliers responded to its conflict-minerals survey, and just 1,217 submitted a completed template, an effective completion rate of 51.8%, as recorded in its conflict minerals report. Registration isn’t assessment either. SFS Group reported that 51.2% of its 12,173 suppliers were registered on its online supplier-assessment platform in 2024, per its 2024 annual report.
The record set behind these statuses is what SIX PurchaseFlow holds together: purchase requests, supplier offers, approvals, purchase orders and incoming deliveries in one controlled process, giving purchasing, warehouse, manufacturing and finance teams a shared view of what was ordered, when it should arrive and what arrived. Clean records are the precondition for any score, and the guidance on keeping ERP system data reliable covers the validation habits that keep a scorecard honest.
Weighting the Score and Setting Hard Gates
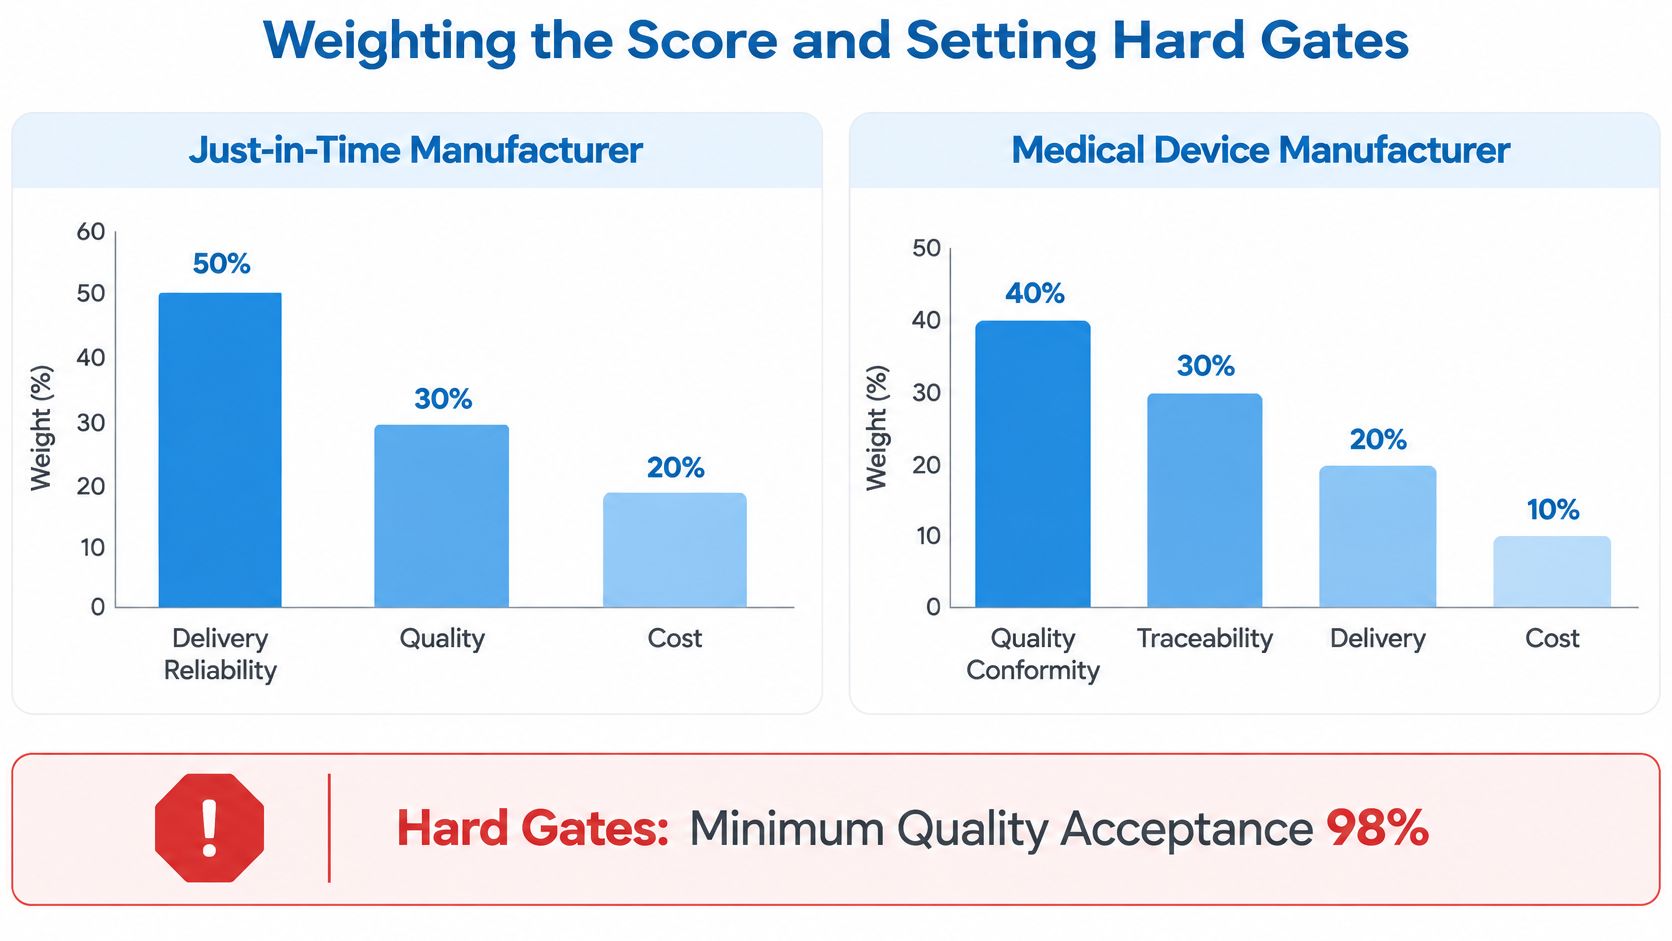
Weights express what a failure costs you. A manufacturer running just-in-time receipts puts most of the weight on delivery reliability. A medical device maker puts it on quality conformity and traceabilityTraceability follows a product or material through its history, from origin to use or delivery. An ERP system connects the records needed to investigate issues and track affected items.. A distributor puts it on price, lead time and availability.
| Performance category | Illustrative weight | Raise the weight when |
|---|---|---|
| On-Time Delivery | 30% | Production runs on just-in-time receipts |
| Quality Performance | 30% | Parts affect safety, medical use or regulated products |
| Lead-Time Reliability | 20% | Planning depends on fixed replenishment windows |
| Price Performance | 10% | Commodity materials with frequent price changes |
| Responsiveness | 10% | The supplier handles urgent shortages or corrective actions |
| Total | 100% | Weights are reviewed each quarter |
Those percentages are an illustrative business model. Adjust them to your own cost of failure before the first review, and treat the review cadence as part of the weighting itself, because a mix set once and never revisited drifts away from what hurts you.
Turning five scores into one number
Each KPI is normalized to a 0-100 score against its target and capped at 100, so one excellent metric can’t compensate for a failing one. Multiply by the weight and add. Say a supplier scores 92 on OTD, 97 on quality, 85 on lead time, 70 on price and 90 on responsiveness. The total is 0.3 × 92 + 0.3 × 97 + 0.2 × 85 + 0.1 × 70 + 0.1 × 90 = 89.7. The arithmetic is the easy part. Whether 89.7 means “healthy” depends entirely on what sits underneath it.
Where the average stops being trustworthy
A composite score can hide a failure with real consequences. A safety nonconformance, a regulatory breach or missing traceability caps the rating regardless of the total, because an average has no way to say this one item outweighs the rest.
The IntegrityNext 2025 research supports that two-layer design. According to IntegrityNext’s sustainable procurement research, half of surveyed organizations struggled to measure the impact of sustainable-procurement initiatives, citing unreliable supplier ESG data, internal silos, limited budgets and limited expertise, and a companion 2025 CSRD pulse survey reported in the same research found only 23.8% of respondents emphasized supplier or partner evaluation while 41.7% rated value-chain integration at the highest difficulty level. Coverage is partial even where the intent is serious: PhosAgro reported that 68% of its suppliers underwent ESG evaluation in 2024, with 63% of procurement spending coming from evaluated suppliers, per its 2024 integrated report.
So the gate has to state what “verified” means for each critical risk. Scorecards that hold up run threshold gates for those risks first, then apply weighted performance scoring to the trade-offs that matter.
One universal scorecard still fails. Raw materials, maintenance parts and packaging need different weights and different gates, and a sheet that treats them the same produces a number nobody trusts.
Thresholds, Escalation and Corrective Actions
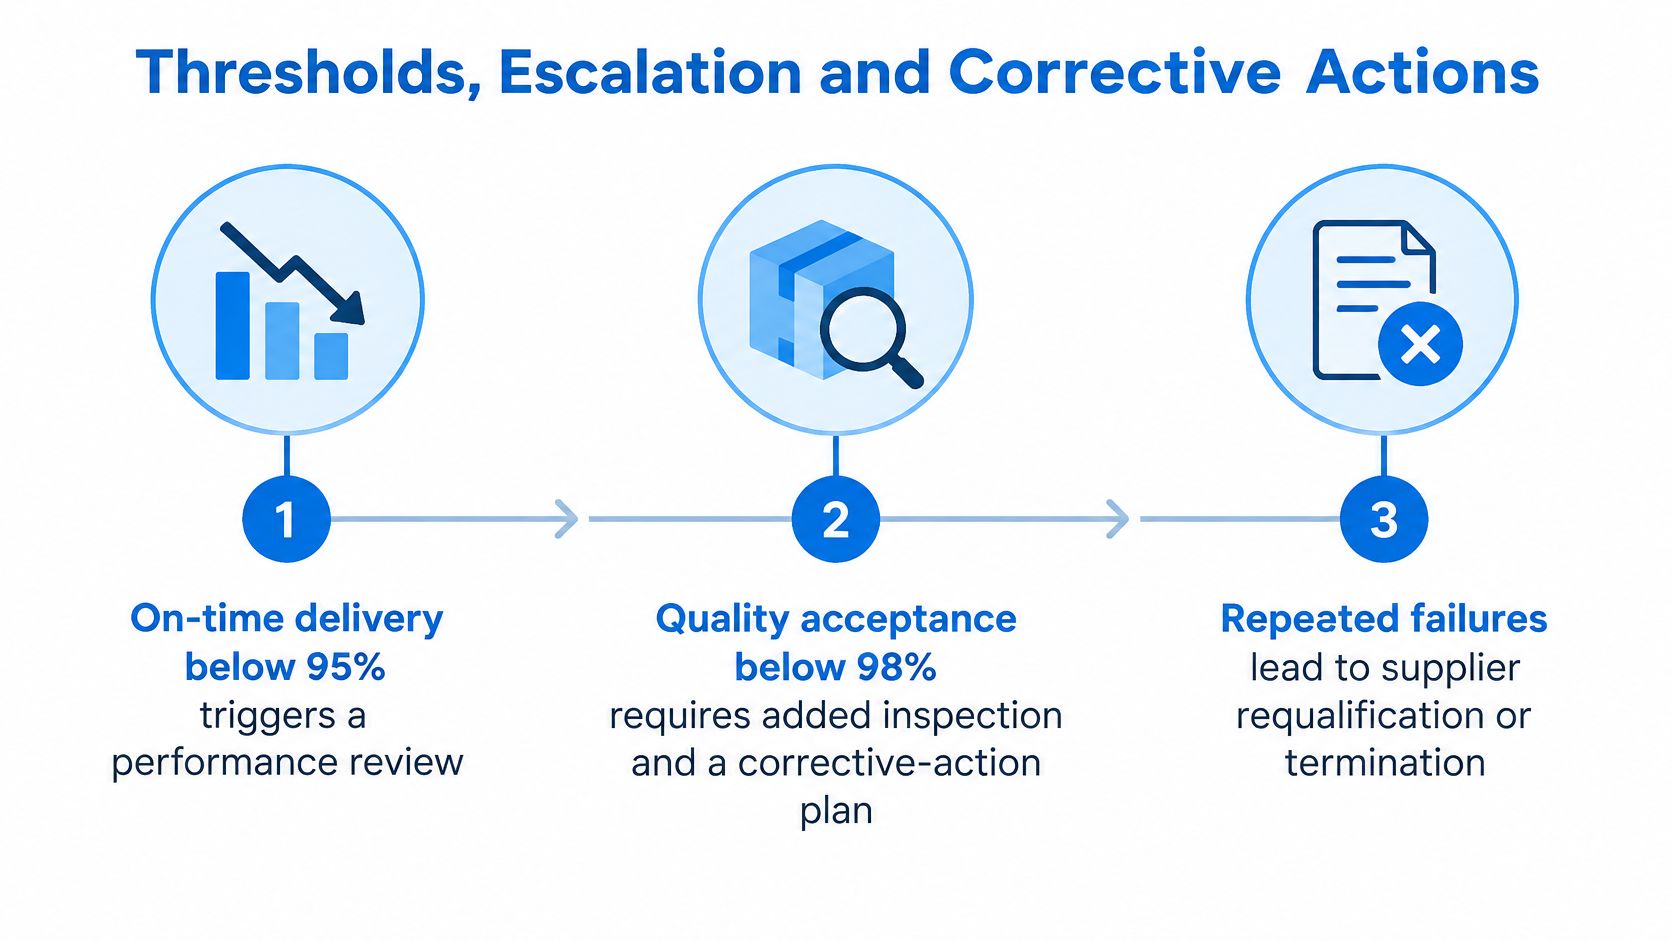
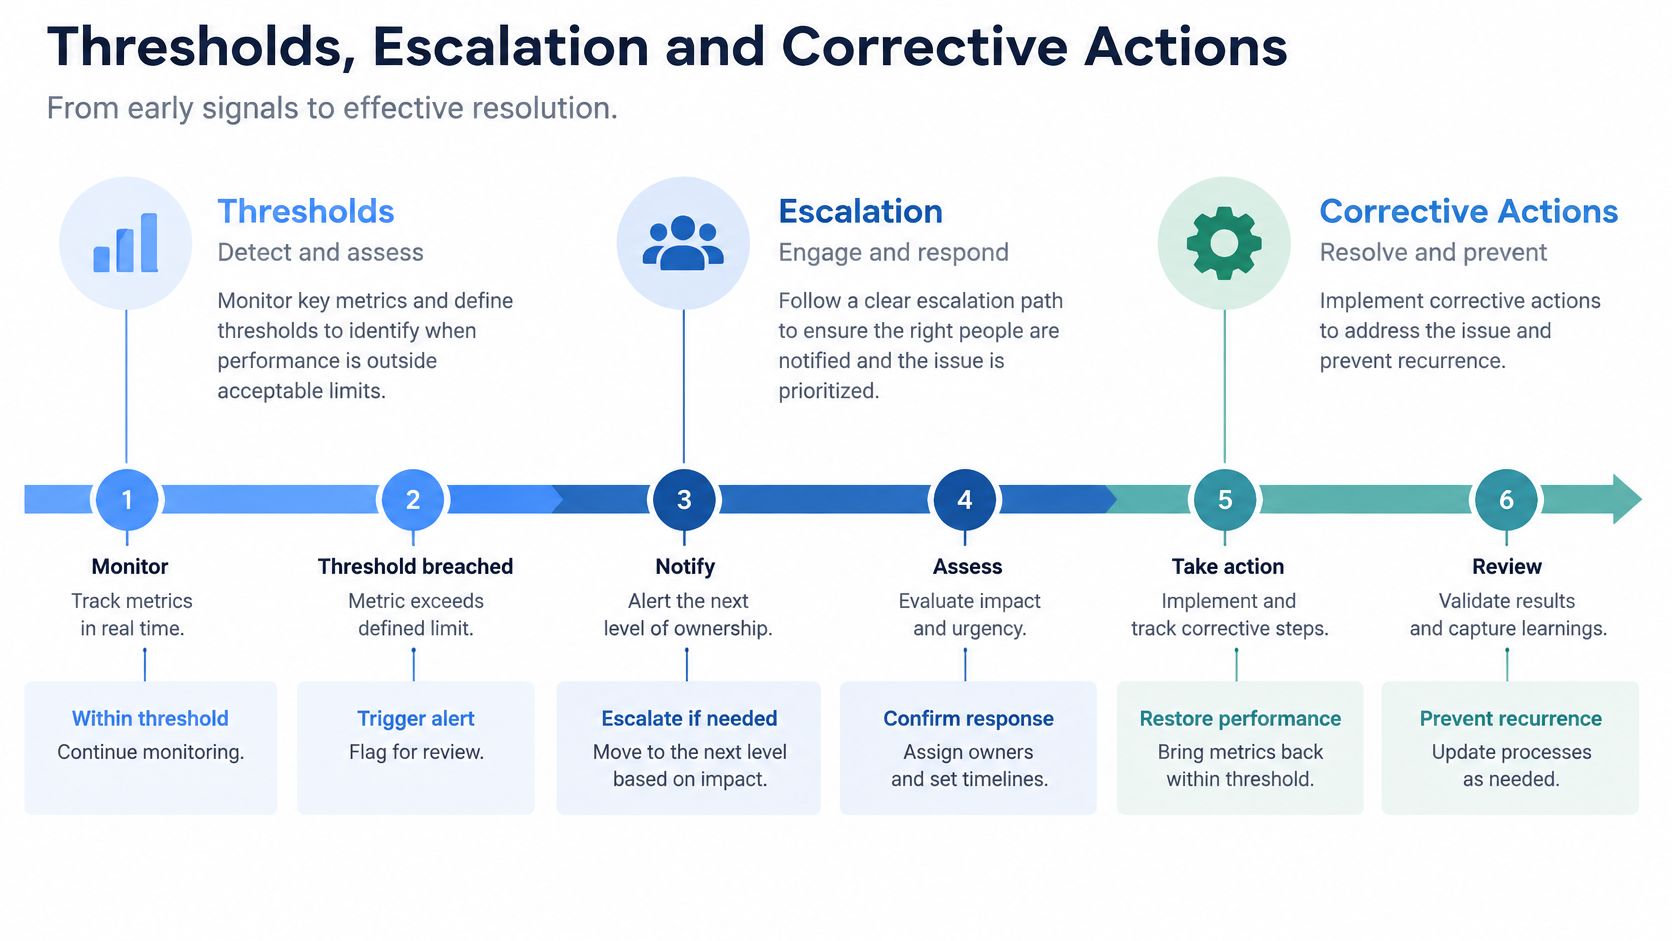
A scorecard earns its keep at the moment a threshold breaks. Set the triggers before the first review, agree them with purchasing, quality and production, and write them down. These are illustrative starting points rather than legal requirements or SIX ERP defaults.
- On-time delivery below 95% triggers a performance review with the supplier.
- Quality acceptance below 98% requires added incoming inspection and a corrective-action plan.
- Repeated lead-time deviations above 10% mean the planning assumption in MRP is wrong and needs updating.
- A critical defect or a shortage that stops production triggers immediate escalation, whatever the overall score says.
- A breach in two consecutive periods moves the supplier into a formal workflow rather than generating another warning email.
A single bad month is noise. Two consecutive periods is a pattern, and a pattern is what earns a corrective action.
The escalation ladder
Escalation isn’t a single leap to replacement. The first step is increased monitoring, with monthly reviews and tighter inspection. The second is qualifying a second source for the material, which takes time and belongs on a plan with dates. Changing suppliers is the last step, and it’s justified by trend data over several periods rather than one delayed container. A supplier you replace after one bad month is a supplier you’ll re-qualify in a year.
Five steps in a corrective action
- Identify the deviation and attach the transaction references, so the supplier can see the receipts, not just the verdict.
- Investigate the cause together. A late delivery caused by your own changed release date isn’t the supplier’s problem.
- Agree the actions and a due date, in writing.
- Assign one owner on each side. Shared ownership means no ownership.
- Monitor the next deliveries until the trend recovers, then close the record.
Context has to sit beside the numbers. An occasional delay during a major logistics disruption isn’t the same signal as repeated avoidable late deliveries from a supplier with capacity to spare. Treating both identically burns goodwill and turns reviews into arguments.
Spotting Supply Risk Behind a Strong Score
A supplier can hold 98% OTD and still be the single point of failure for your best-selling product. Delivery performance describes the past. Risk describes what a disruption would cost you next quarter, and the scorecard doesn’t measure it.
Five checks behind the score
- Single-source dependency comes first. Count approved sources for every critical material and flags any material with exactly one, however good that supplier’s rating looks.
- Replenishment time magnifies everything else. A 14-week lead time turns a two-week disruption into a stockout, and no delivery score captures that exposure.
- Geographic concentration is the share of spend or volume tied to one region, port or route. Two approved suppliers in the same industrial zone are one supplier in a flood.
- Capacity limits show up as repeated short shipments in peak months. A supplier running near full capacity will keep missing quantities until demand drops.
- Product exposure asks which finished goods stop if one input goes missing. That answer sets the priority order for everything above.
What to do with a flag
Give every flagged material a second-source qualification plan with an owner and a target date. Take a plastics molder that relies on one resin supplier with 98% OTD and a 14-week lead time. It can plan to qualify a second supplier over two quarters, starting with a trial order at 10% of volume, and keep the original supplier as the primary while the second proves out.
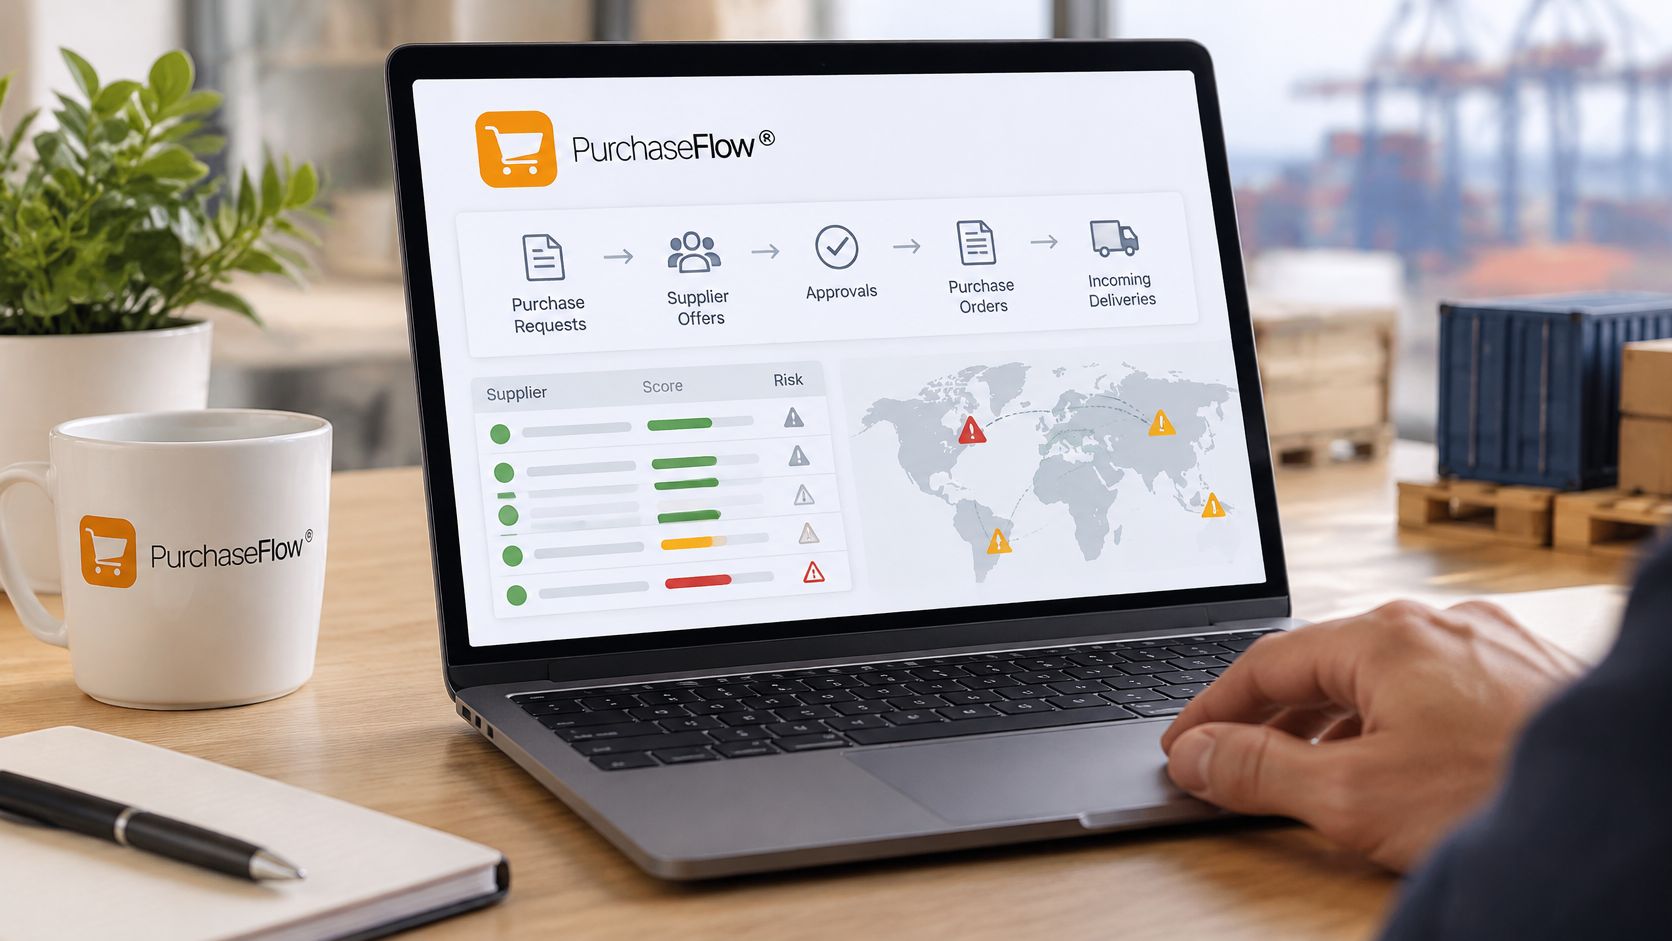
Supplier records, approved-source lists and agreed delivery dates are what make these checks possible at all, and they belong in the same system as the purchase orders.
Scores also can’t see everything. They measure what a supplier reports and delivers, not whether the supplier is honest about it. Where a relationship carries financial or regulatory exposure, spotting supplier fraud and bribery through independent audit covers the controls a performance score will never reveal.
Scorecards don’t predict disruption. They provide evidence for purchasing decisions and risk assessments, and the planner still has to judge what that evidence means. For the wider picture on buffering against disruption, the guide to supply chain resilience covers the planning side.
Replacing Impressions With Supplier Scorecard Evidence
Take a metal fabricator buying sheet steel and fasteners from six suppliers. Before structured evaluation, purchasing chooses from price lists, personal experience and a shared spreadsheet, and production complaints arrive by email. The same supplier keeps winning steel orders despite recurring short shipments, because the complaint never turns into a number anyone can compare.
Six months of receipts change the conversation. Supplier C, the lowest-priced steel source, delivered on time in 84% of receipts. Supplier D delivered on time in 96% of receipts at a price 1% higher. All figures here are hypothetical and are not SIX ERP benchmarks.
Three decisions follow:
- Volume moves: 30% of steel volume goes to Supplier D under a revised delivery clause.
- Planning corrects: the MRP lead-time assumption for Supplier C rises from 10 to 14 days, which cuts expedite fees.
- Performance improves: a corrective-action plan with Supplier C sets a 90-day review.
A scorecard changes behavior when the score is hard to argue with. A receipt date is hard to argue with.
The stakes are measured at scale. Deloitte’s 2025 Global Chief Procurement Officer Survey found that 84% of procurement organizations identified as digital leaders met or exceeded their supplier-performance plans, compared with 59% of digital followers. None of the three decisions above would survive a review without the receipts behind them, which is exactly why they can be revisited openly later.
How SIX ERP Connects Purchasing, Stock, Production and Finance Records
Four modules in SIX ERP each supply one input to a supplier score, and each answers a different question.
PurchaseFlow holds the supplier ID, agreed prices and confirmed delivery dates, which is what the supplier promised. StockFlow records warehouse receipts and material movements, which is what arrived and when. ManufacturingFlow links material availability to production requirements, so a late receipt identifies which production orders sat idle and what the rescheduling cost. FinanceFlow connects purchasing transactions to invoices and costs, which puts price variance and total spend on the same report as the delivery result.
The practical effect is one shared view. Open a supplier’s record and purchasing sees the late receipts on the steel line, production sees the orders that waited for them, and finance sees the invoice variance attached to the same supplier key. The argument about whose number is right stops, because all three teams are reading the same transactions.
One boundary stays on your side of the table. Scoring formulas, weightings and corrective-action workflows are configured during implementation to match the rules your purchasing, quality and production teams agree. SIX ERP keeps the records and the audit trail; the decision to renegotiate, reallocate or exit remains yours, along with the legal and regulatory duties that come with it.
Launch Your First Supplier Scorecard in Eight Steps
- Choose the scope. Start with the suppliers and material categories that drive most of your spend, or most of your production stoppages, usually the top 20%.
- Write the formulas. Select four to eight KPIs and define each calculation, target and data source in one line, so nobody reinterprets it later.
- Check the join. Confirm that purchasing, receipt and quality records share one supplier key before you calculate anything.
- Agree the rules. Set weights, hard gates and thresholds with purchasing, quality and production in the same room.
- Build a baseline. Calculate six to twelve months of history and expect a few surprises.
- Audit the first scores. Look for data errors and unfair classifications, especially internal delays booked as supplier faults.
- Set the rhythm. Review operational indicators monthly and strategic ones quarterly. This will allow you to check if a corrective action breaks the threshold.
- Measure the effect. After two review cycles, check whether purchasing and production performance improved.
SIX PurchaseFlow provides structured requests, faster approvals, supplier transparency and control from demand through delivery, which is the record base the first three steps depend on. Support scope, response times and service levels should be agreed and confirmed in the support arrangement for your organization, and a demonstration shaped around your business rather than a generic product tour is the quickest way to see how the flow fits your supplier process.
This week, list your ten most production-critical suppliers and check whether each one has purchase orders, goods receipts and quality records linked by a single supplier key. Where a link is missing, that’s your first fix, and it’s usually cheaper than any new reporting tool. Then book a session with a SIX expert to shape the setup around how your purchasing team works.
SIX ERP connects purchasing, inventory, manufacturing, quality and finance records so that a supplier score can be traced back to the order, receipt and inspection behind it, which is what makes a review a discussion about facts rather than a debate about impressions. If you’d rather build the scorecard around your own supplier process than force your process into a template, we’ll walk through your current records with you and show where the gaps sit. Book a meeting with a SIX ERP Expert to improve your procurement processes.